Ioana Agapie (Mereuță), Mihail Luca, Paul-Marian Gherasim, Violeta Dominte (Croitoru)
ABSTRACT. The paper presents a series of results regarding the application of GNSS technology for measuring displacements to earth dams. An appropriate horizontal and vertical deformation-tracking network must be established for the rapid monitoring of earthmoving movements. Data obtained from the monitoring network can be used in the earth dam stability analysis program. Periodic tracking of earth dams using GNSS technology provides high accuracy of spatial distortions. The results of the paper show the application of GNSS technology to monitor the deformations of the Podisu earth dam located on the Sheep Valley River in Iasi County. In the first stage of research (2019 and 2020), the local geodetic tracking network was created. To monitor the dam, four control landmarks were placed on the crest of dam and seven landmarks on the downstream slope. In the second stage of the research (year 2021) the measurements of the displacements at the earth dam were performed. The GNSS monitoring method has the advantage of positioning the target quickly, statically, and with high accuracy. The measurements used fixed stations located at two points in the local geodetic network. Four Trimble GNSS receivers were used for the measurements. The resulting data was processed using the Trimble Business Centre program. The obtained results were analysed in comparison with those existing in the design documentation and technical expertise of the dam. The results highlight the presence of displacements on the crest of a dam and slopes of the dam. The final findings highlight the performance of GNSS technology in the monitoring process, where it provides millimetre-accurate accuracy with high spatial and temporal accuracy.
Keywords: earth dam, static measurements, GNSS, geodetic network.
Cite
ALSE and ACS Style
Agapie (Mereuță), I.; Luca, M.; Gherasim, P.-M.; Dominte (Croitoru), V. Design of GNSS networks for monitoring earth dams deformations. Journal of Applied Life Sciences and Environment 2021, 54(4), 354-369.
https://doi.org/10.46909/journalalse-2021-031
AMA Style
Agapie (Mereuță) I, Luca M, Gherasim P-M, Dominte (Croitoru) V. Design of GNSS networks for monitoring earth dams deformations. Journal of Applied Life Sciences and Environment. 2021; 54(4): 354-369.
https://doi.org/10.46909/journalalse-2021-031
Chicago/Turabian Style
Agapie (Mereuță), Ioana, Mihail Luca, Paul-Marian Gherasim, and Violeta Dominte (Croitoru). 2021. “Design of GNSS networks for monitoring earth dams deformations” Journal of Applied Life Sciences and Environment 54, no. 4: 354-369.
https://doi.org/10.46909/journalalse-2021-031
View full article (HTML)
Design of GNSS Networks for Monitoring Earth Dams Deformations
Ioana Agapie (Mereuță)1*, Mihail Luca2, Paul-Marian Gherasim1, Violeta Dominte (Croitoru)1
1“Gheorghe Asachi” Technical University, Iasi, Doctoral School, Romania
2“Gheorghe Asachi” Technical University, Iasi, Department of the Land Reclamation and Environmental Protection, Romania
*E-mail: ioanaagapie@yahoo.com
Received: Dec. 07, 2021. Revised: Mar. 25, 2022. Accepted: Apr. 11, 2022. Published online: Apr. 12, 2022
ABSTRACT. The paper presents a series of results regarding the application of GNSS technology for measuring displacements to earth dams. An appropriate horizontal and vertical deformation-tracking network must be established for the rapid monitoring of earthmoving movements. Data obtained from the monitoring network can be used in the earth dam stability analysis program. Periodic tracking of earth dams using GNSS technology provides high accuracy of spatial distortions. The results of the paper show the application of GNSS technology to monitor the deformations of the Podisu earth dam located on the Sheep Valley River in Iasi County. In the first stage of research (2019 and 2020), the local geodetic tracking network was created. To monitor the dam, four control landmarks were placed on the crest of dam and seven landmarks on the downstream slope. In the second stage of the research (year 2021) the measurements of the displacements at the earth dam were performed. The GNSS monitoring method has the advantage of positioning the target quickly, statically, and with high accuracy. The measurements used fixed stations located at two points in the local geodetic network. Four Trimble GNSS receivers were used for the measurements. The resulting data was processed using the Trimble Business Centre program. The obtained results were analysed in comparison with those existing in the design documentation and technical expertise of the dam. The results highlight the presence of displacements on the crest of a dam and slopes of the dam. The final findings highlight the performance of GNSS technology in the monitoring process, where it provides millimetre-accurate accuracy with high spatial and temporal accuracy.
Keywords: earth dam, static measurements, GNSS, geodetic network.
INTRODUCTION
The operation of earthworks must be carried out in a safe manner in accordance with the rules in which they were designed and executed. Maintenance, repair, rehabilitation and modernization works contribute to increasing the operational safety of the earth dams compared to the actions present at the site. The proper management of dams during the operation period significantly influences the environment and the human environment.
Climate change in the last 30 years has influenced the annual distribution of rainfall and implicitly the flow in the riverbed in Romania (Avram and Luca, 2017). Analyzes of exposure to various hazards and vulnerability in the countries of south-eastern Europe have indicated that the common danger is flooding. Romania ranks second on the production of floods with catastrophic consequences on the objectives in the riverbed and in the riparian area (WBA Prut-Barlad, 2018). Among the vulnerable targets are low-rise earth dams.
The actions generated by the location of an earth dam cause its degradation during operation. A statistical analysis (ICOLD, 1995) shows that the most frequent damages to earth dams are generated by various actions, such as: low capacity of discharges – 30%, suffusion phenomenon – 23%, landslides – 10% , other causes – 37%. At the same time, dams made of local materials are the most exposed to accidents caused by current climate change. The largest number of land dams in Romania is located in the Prut – Barlad River basin. Most of the damage is also recorded in this river basin (ABA Prut-Barlad, 2018).
Studies and research conducted (ICOLD, 1995; Luca and Hobjila, 2002; Boboc and Mitroi, 2016) highlight the negative phenomena that occur in the structure of earth dams generated by random actions at the site. Some of these phenomena are generated by the absence of the process of monitoring the structural parameters at the earth dams (Hobjilă and Luca 2000, Luca and Pop, 2016). Early detection of defects and anomalies is a very important step in assessing the integrity of earth dam structure and risk management (Seyed-Kolbadi et al., 2020).
Monitoring the structural condi-tion of earthworks is a necessity for their safe operation and is required by current regulations (NTLH 021, 2002). Observations and measurements made during the operation period are actions that can contribute to the analysis of the safety status of the dam.
Dams in Romania are classified according to the value of the risk associated with four categories of importance (NTLH 021, 2002):
A – exceptional importance;
B – special importance;
C – normal importance;
D – low importance.
Dams of category A and B are equipped with an adequate system for monitoring their behaviour over time and are serviced by specialised staff (Priscu, 1974). Category C and D dams (generally made of earth) do not have a specialised system for monitoring movements in their bodies.
Prior to 1990, all dams, regardless of their importance, were under state administration. After 1990, a large part of the category C and D dams were taken over by private administration, or were abolished. About 95% of the category C and D dams in the eastern part of Romania are privately operated (WBA Prut-Barlad, 2018). This situation has led to the structural parameters of the dams no longer being monitored by the Water Basin Administrations (WBA).
The current technical condition of many type C and D dams creates dangers for the natural and human environment through damage and accidents over time (Luca et al., 1997; Sbiera, 2006). Technical expertise over the last 30 years has shown that an adequate control program does not monitor a large part of the dams (Luca et al., 1997; Tanasescu, 2017). It follows that category C and D earth dams need to be monitored at fixed intervals, given the high frequency of partial and total damage and degradation over the last 30 years.
The monitoring of the horizontal and vertical deformations of the dams in Romania has been done so far, by means of classical geodetic methods (angular and length measurements) (Vele et al., 2014). The development of modern technologies for measuring construction displacement has allowed an optimisation of the process of data collection and processing (Bond, 2008; Levent, 2008; Kalkan, 2009).
Absolute displacements of the dam surface are usually determined by topographic and geodetic methods, such as precision levelling (for settlement) and alignment (for horizontal displacements). The determination of the horizontal and vertical displacements for the inaccessible points on the dam faces and slopes is achieved by microtriangulation (Chirilă and Casandrescu, 2015).
The use of Global Navigation Satellite System (GNSS) technology has tested the capacity of spatial geodetic networks to meet the requirements of precision in monitoring horizontal and vertical deformations of buildings and dams (Corea-Munoz and Ceron-Calderon, 2018; Chirila et al., 2020).
Modern GNSS technology uses high-performance tools to monitor geospatial deformations (Andrei, 2012). This contributes to a full understanding of the structural and tectonic mechanisms caused by the interaction between the lake, the site and the dam body. GNSS technology allows high measurement accuracy with relatively little effort, compared to conventional terrestrial techniques (Andrei, 2012; Agapie and Luca, 2020; Kalkan, 2009).
Avoiding misinterpretations of the movements at the specific points on the dam body is achieved by using high-performance software to process the measurement data taken. Also, the correct interpretation of the data obtained in the geodetic monitoring networks is a limiting factor, which can introduce errors (Levent, 2008; Chirila and Casandrescu, 2015).
The research conducted by Corea-Munoz and Ceron-Calderon (2018) highlighted the applicability of the GNSS system in civil engineering, and research by Chirilă and Căsăndrescu (2015) confirmed the applicability of GNSS to monitor movements of concrete dam components, such as overflows.
This paper presents a series of results and suggests a way to create a GNSS system for the rapid retrieval of geodetic data on trips to earth dams of category C and D in Romania.
MATERIALS AND METHODS
Research was carried out in the river basin of the Bahlui River, in the eastern part of Romania. The geographical area is known for the presence of earth dams of category C and D. On the Sheep Valley River are located in the waterfall a number of eight accumulatision with functions of flood mitigation, fishing and ensuring the flow of easements downstream.
The object of study is the Podișu earth dam, which is classified as a category C dam (Fig. 1). The dam is located on the Sheep Valley River, in the area of the Baltati commune, Iasi County. The volume of the accumulated lake is 0.601 million m3 and it has a fishing and flood mitigation function. Access to the dam is along a branched exploitation road from the DC116 communal road towards Podisu.
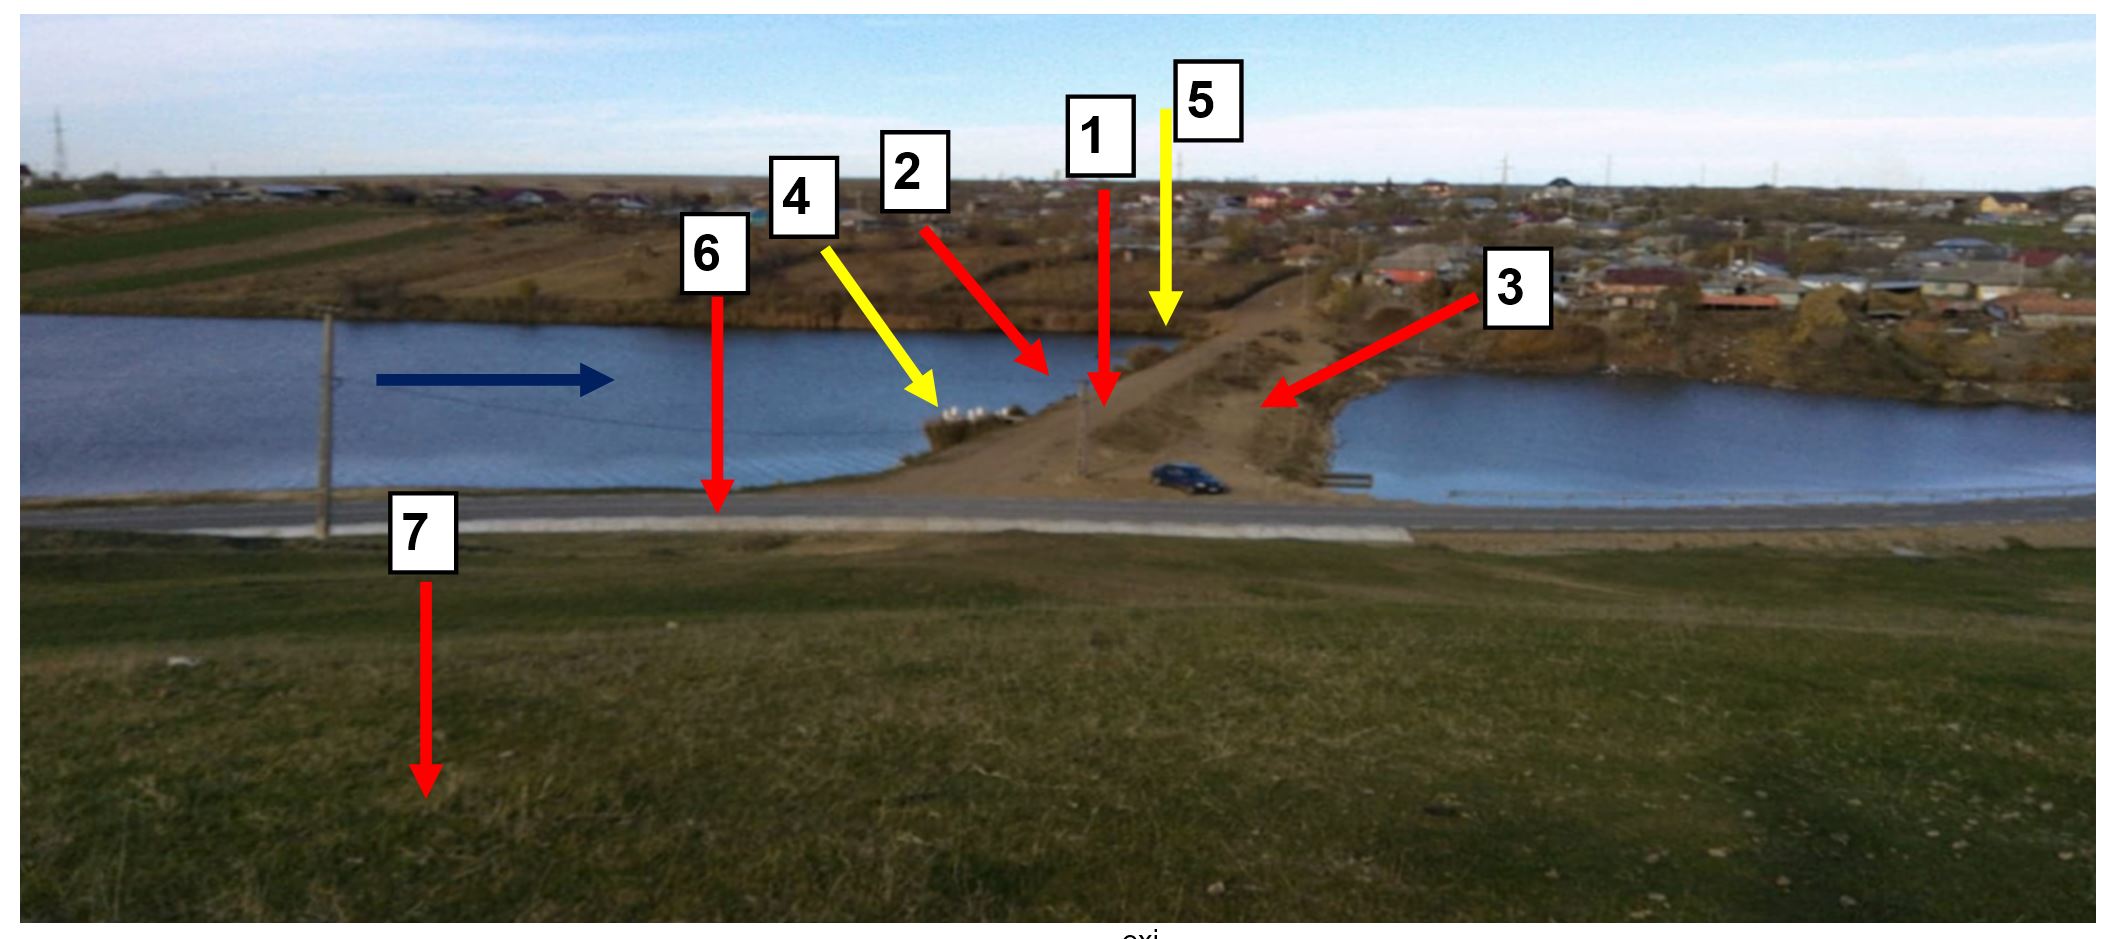
Figure 1 – General view of the Podisu dam: 1 – crest of a dam; 2 – upstream slope; 3 – downstream slope; 4 – bottom water outlet C1; 5 – funnel overflow C2; 6 – road; 7 – the right slope (source: author)
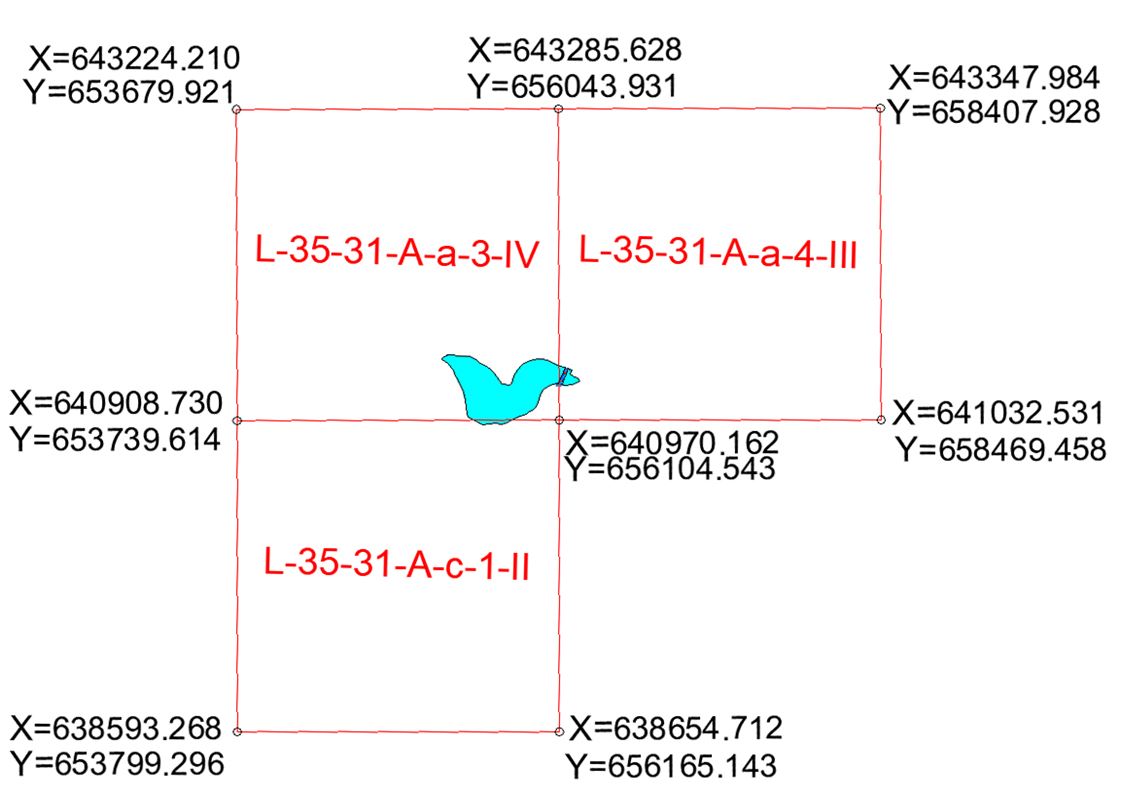
The Podisu fishery arrangement is mapped on three geodesic trapezoids. These are made at a scale of 1: 5000 (Fig. 2), having the nomenclatures L-35-31-A-a-3-IV, L-35-31-A-a-4-III and L-35-31-A-c-1-II.
The Podisu dam is homogeneous in structure and was constructed in 1962, from land taken from the location area. The cross section of the dam has a trapezoidal shape and the geometric parameters are as follows (Sbiera, 2006) (Fig. 3):
– maximum height 3.90 m;
– length of dam crest 104.0 m and width 4.50 m;
– the slope of the upstream shell 1: 1.0 and the downstream shell 1: 2.0.
The dam has been in operation for about 68 years and was severely damaged in 1970 (Sbiera, 2006).
The water from the accumulation lake created by the Podisu dam is discharged with two evacuating structures downstream: C1 – manoeuvring tower with bottom outlet; C2 –
funnel overflow with bottom outlet gallery.
The evacuators are located in the body of the dam on the upstream slope as follows (Fig. 4a): C1 on the right and C2 on the left.
A layer of large rough stone protects the upstream face slope, and the downstream face slope is protected by grassland. The dam crest is trafficable. The dam does not have a water drainage system for infiltrated waters (Tanasescu, 2018).
The C1 evacuator structure is a manoeuvring tower provided with a spillway on three sides (Fig. 4b). The front spillway has a ridge at a lower level, and over it, are mounted cofferdams to regulate the water level in the lake and the discharged flow. The bottom outlet pipe has a mixed cross section (rectangle semicircle) with dimensions of 1.00 x 1.60 m (Sbiera, 2006).
The C2 evacuator consists of a funnel spillway, continued with the bottom gallery. The funnel overflow has a rectangular section measuring 6.00 x 3.50 m and a length of 19.0 m. The bottom outlet gallery has a rectangular section measuring 2.00 x 2.00 m (Sbiera, 2006). The two exhaust constructions are made of reinforced concrete. The Podisu dam does not have control parts installed for measuring the movements on the crest and face slopes, a situation determined by its category of importance. Only the water level in the lake is measured directly, at the water meter located on the wall of the C1 evacuator (Fig. 4.b).
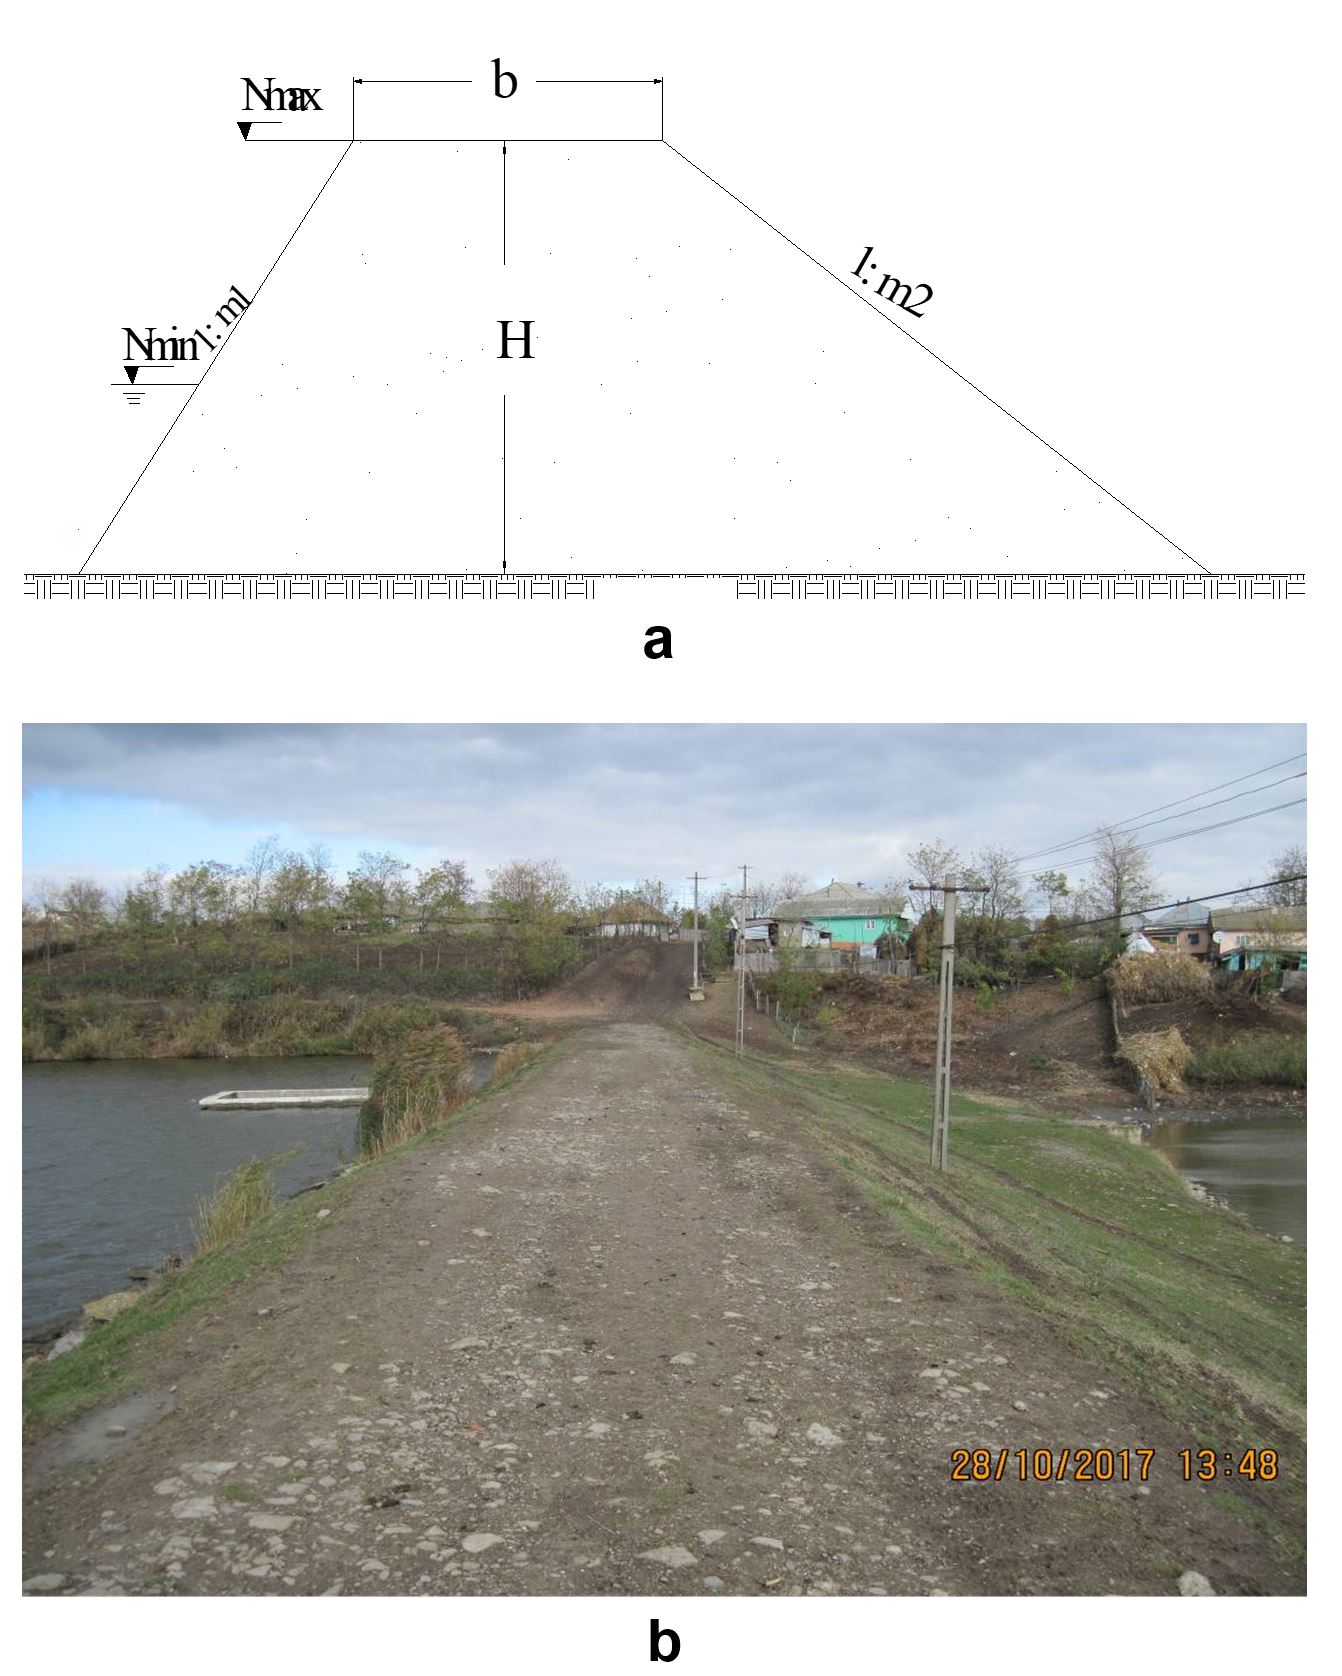
Figure 3 – Podisu earth dam: a – cross section initially executed (Sbiera, 2006); b – general view of the dam, year 2021 (source author)
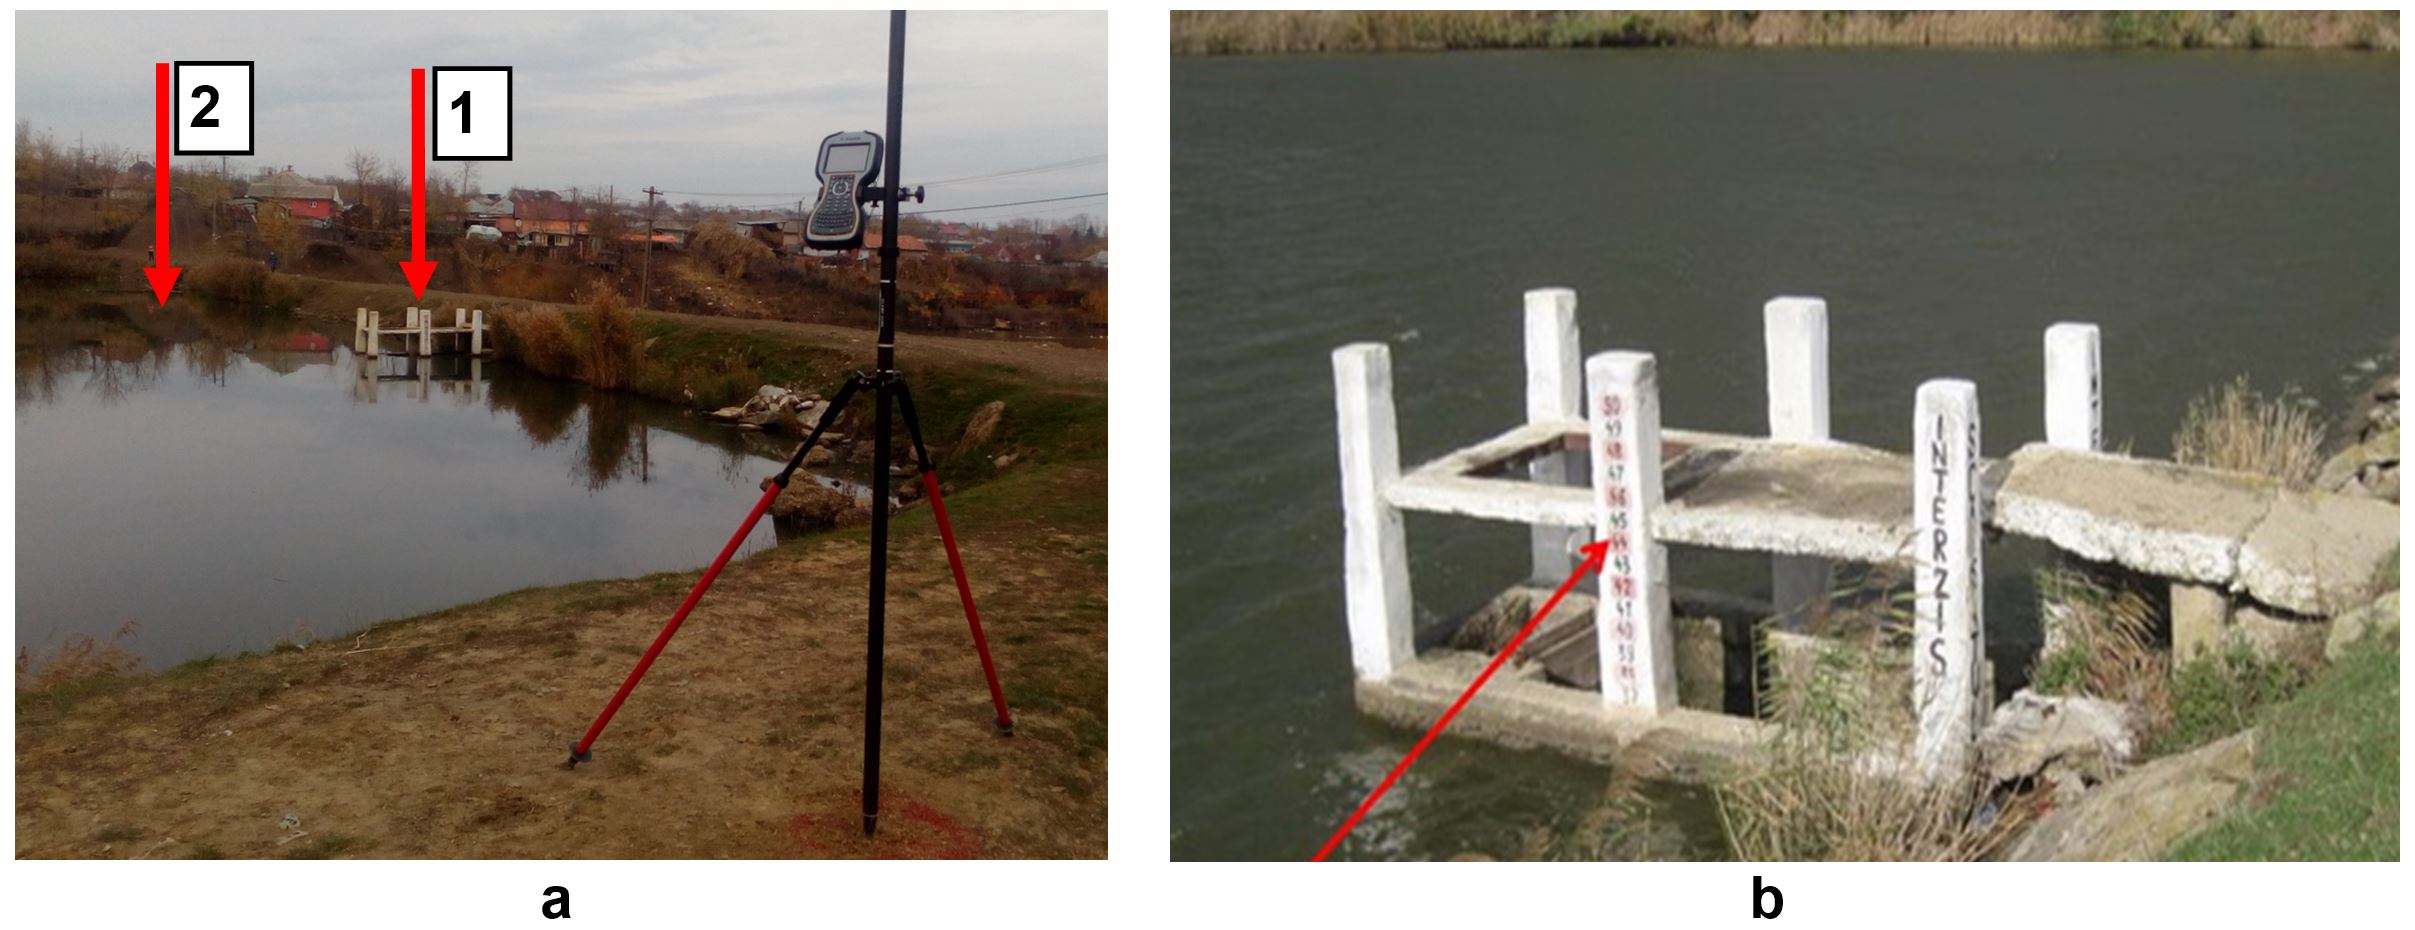
Figure 4 – Flow evacuators of the Podisu dam: a – general view upstream of the dam with the positioning of the evacuators; 1 – C1, 2- C2; b – detail regarding the C1 evacuator and the position of the water meter (source: author).
The research methodology presented the following stages:
- Study of the design documentation of the earth dam and the annexed constructions based on the available data. The material used in the research consisted of expert documentation prepared by by Sbiera (2006) and Tanasescu (2018).
- Recognition of the study area and taking over the current data on the geometric characteristics of the earth dam (length and width of the canopy, tilting slopes, specific heights etc.).
- Analysis of areas with deformations and establishment of cross and longitudinal profiles on the dam to monitor vertical and horizontal movements in the earth material.
- Establishing the station points of the geodetic monitoring network and their in the field.
- Establishment of the measurement points of the geodetic network and materialization in the field on crest, on transversal profiles and at special monitoring points.
- Materialization of the control points on the crest of a dam by landmarks.
- Ensuring the necessary conditions for carrying out the measurements:
- choice of GNSS equipment; it consists of Trimble R8S, Trimble R2 receivers and Trimble TSC3 and Trimble Slate control units (Fig. 5);
- selection of the measurement method (the relatively fast static method was chosen);
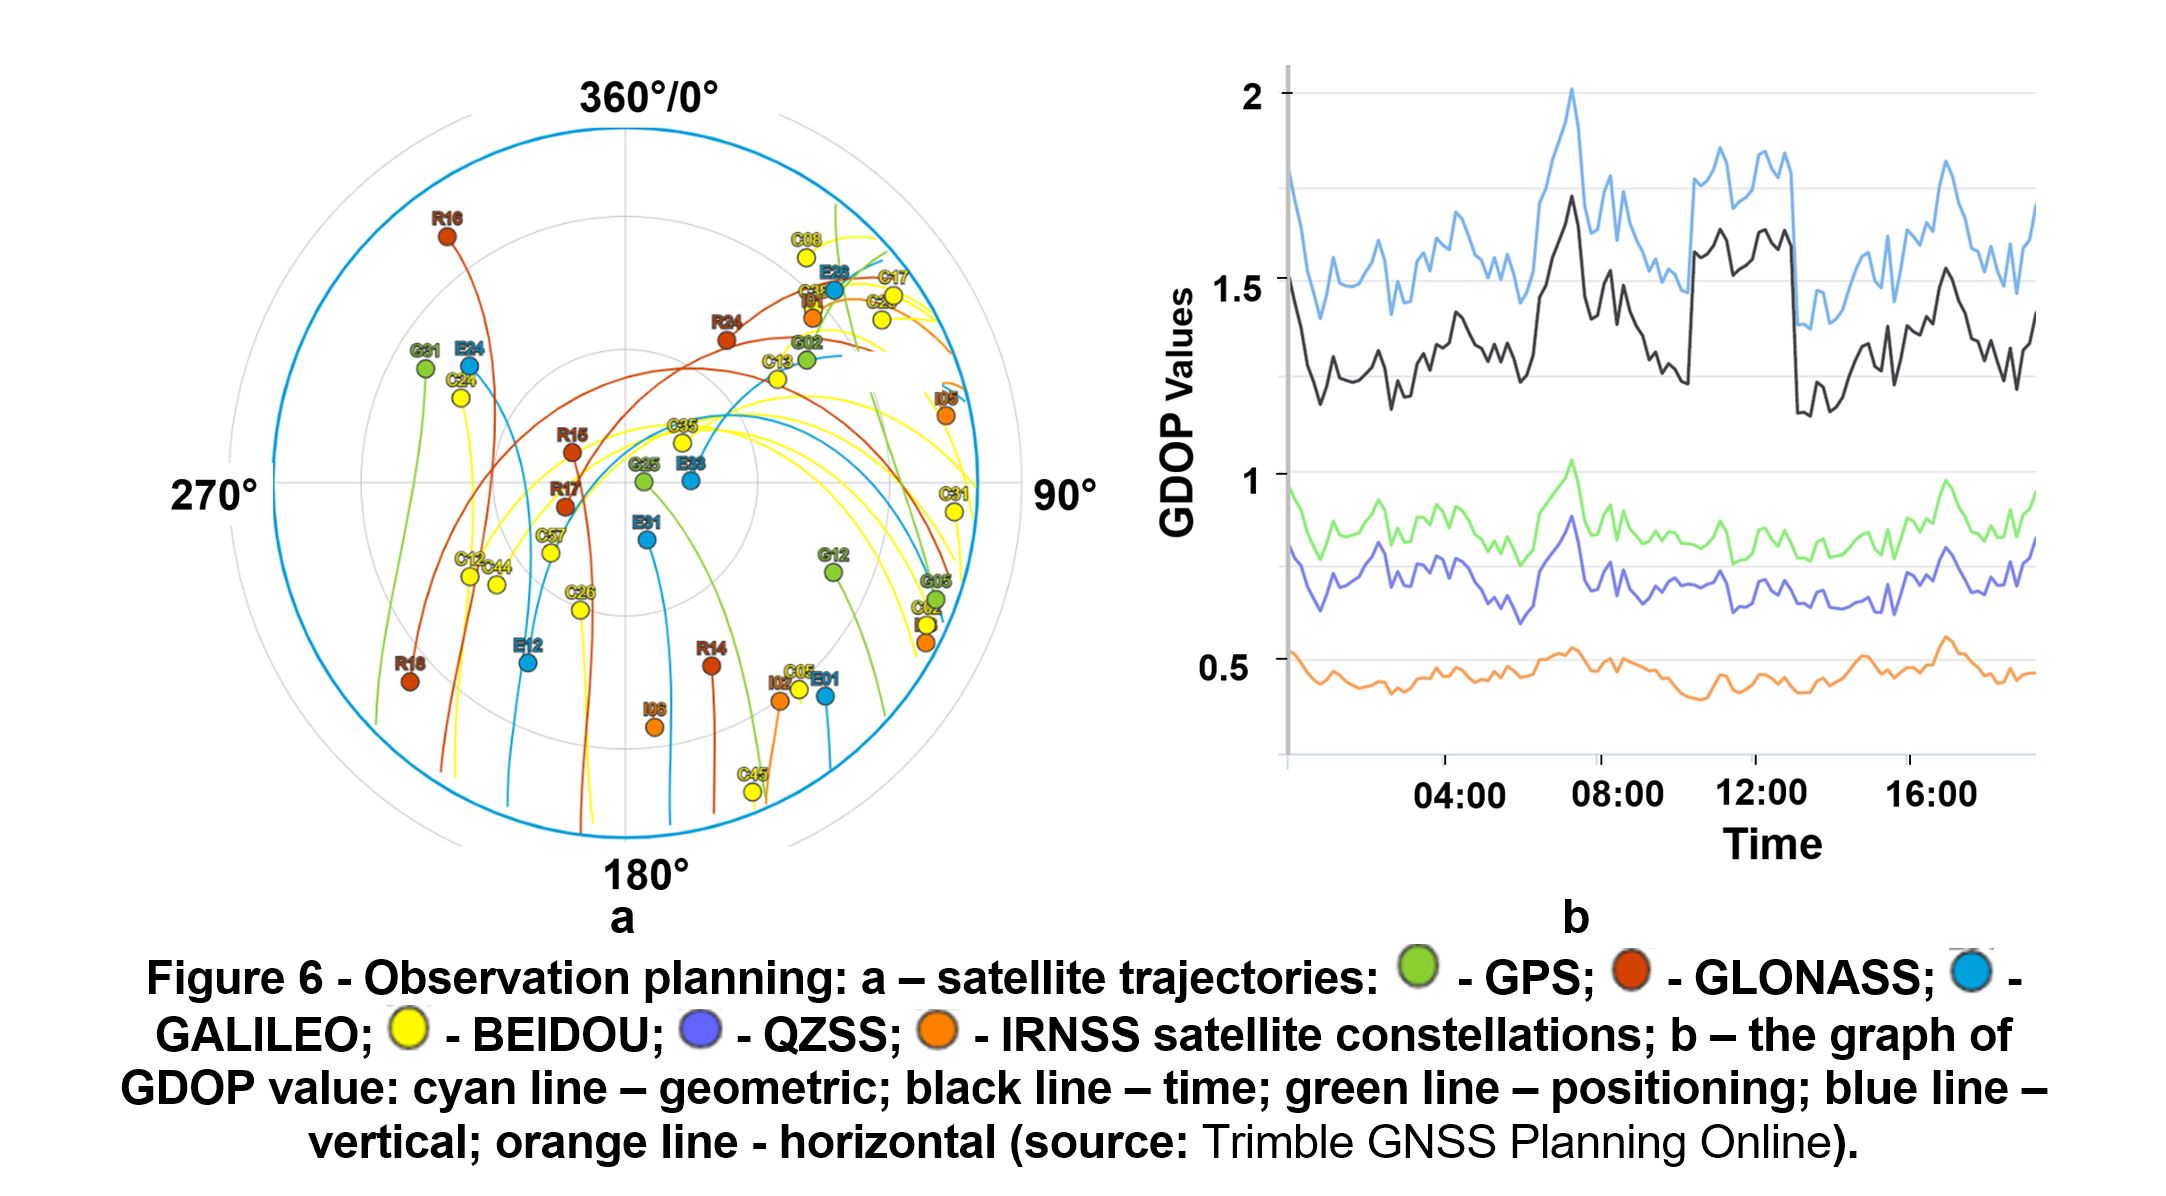
- planning the observations in time according to the changes in the geometry of the dam; the observations were made based on the data provided on the Trimble GNSS Planning Online website (number and type of satellites present in the research area, possible GDOP values in measurements, etc.);
- 6 shows the planning of observations for the first cycle of measurements conducted in November 2019.
- Carrying out measurements by the relatively fast static GNSS method using the points of the geodetic network established in the research area.
- At time intervals imposed by the conditions of operation of the dam, the measurements in the designed geodetic network were repeated. The network is also completed by adding points in sections required by the safety status of the dam.
- During the measurements, photo and video surveys are taken for viewing in the measuring areas and the type of temporal deformations of the dam.
- Selection of specific software for processing measurements using GNSS technology. Processing of experimental data, its analysis, interpretation and representation. Creating the database for the researched objective.
Realisation of the topographic documentations for the analysis of the displacements appearing in the structure of the earth dam.
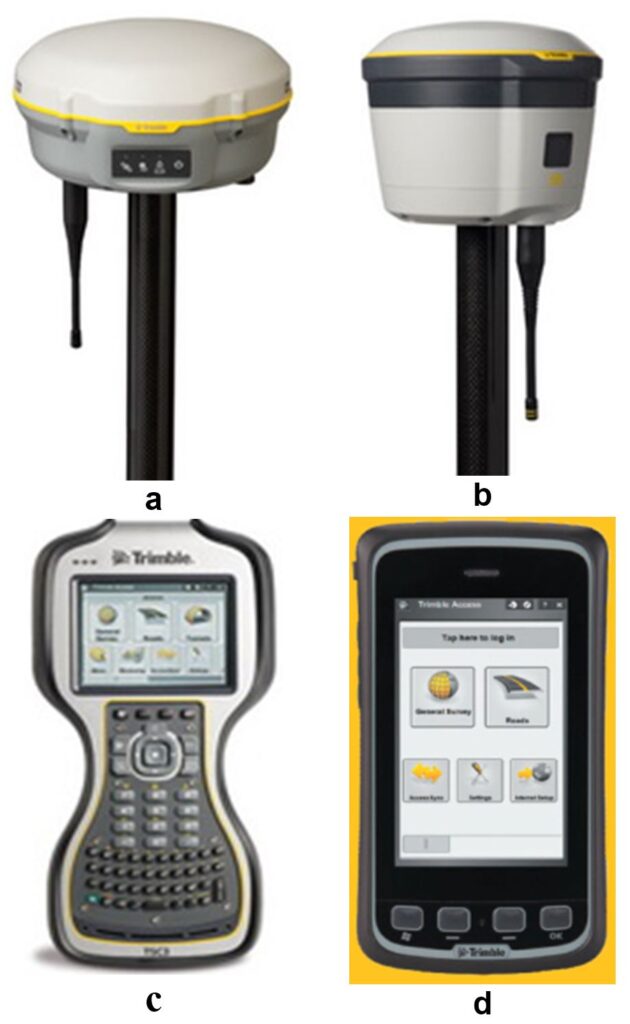
Figure 5 – GNSS equipment used for measurements: a – Trimble R8S receiver; b – Trimble R2 receiver; c – Trimble TSC3 control unit; d – Trimble Slate control unit
The data collected from the field was stored in “databases” in the form of Excel and Word tables according to their content. Primary data was processed by destination:
- monitoring the movements of the earth dam;
- database for the analysis of the dam stability following the occurrence of negative events in the site area;
- database for carrying out the technical expertise required for the granting of the operating license.
The pre-processed data was processed with the Trimble Business Centre program. The topographic documentations were made in the form of tables, graphs, situation plans, longitudinal and cross profiles etc.
Some of the topographic data were used in computer programs to make 2D and 3D models of the dam. 2D and 3D models can be used to simulate the behaviour of the dam in response to the actions present at the site.
RESULTS AND DISCUSSION
The most common damage to earth dams is caused by the phe-nomenon of physical and chemical suffocation. It is generated by the in-filtration of water through the dam body, a situation that causes the washing of fine particles and the production of local settlements. The phenomenon is also confirmed by the statistics found by ICOLD (1995), where damage was found in 23% of earth dams.
The most frequent settlements are located on the crest of a dam, at the bottom outlet and on the downstream face (Luca and Pop, 2016). The importance of monitoring settlements is paramount in ensuring the safe operation of earth dams.
Damage tos to the dams are announced by preliminary phenomena, which are usually signalled more or less visually. It turns out that dam monitoring is a way to reduce risk factors. A monitoring system of the dam and its annexes aims to highlight, with the greatest possible anticipation, the phenomena that may affect their operational safety.
At certain time intervals, technical expertises were performed at the Podisu dam for the analysis of the structural condition, but also the granting of the operation authorisation (Hobjila and Luca, 2000, NTLH 021, 2002, Tanasescu, 2016). The expertises highlighted a series of movement’s on the crest and downstream slope of dam.
The previously mentioned ones were considered when choosing the GNSS technology for measuring the displacements at the category C and D earth dams in Romania. The Podisu dam was chosen as the object of study for the application of GNSS technology.
The purpose of the studies and research was to design and build a local geodetic network, as a model, to use GNSS technology to measure displacements at an existing C and D category dam in Romania.
The movement of dams (vertical and horizontal) is considered relative to a fixed point. At the Podisu dam, the ‘fixed point’ was chosen on the right slope at a distance of 220 m from the dam, in order to avoid the influences given by the construction.
The displacement monitoring system designed for the Podisu dam was made up of a local geodetic tracking network and target points. The tracking network and target points were located on the dam and in the adjacent area.
The condition of the target points is periodically monitored, but also after the occurrence of major events in the operation of the water storage and the dam (taking over floods, rapid discharge of flows, damage, earthquakes etc.).
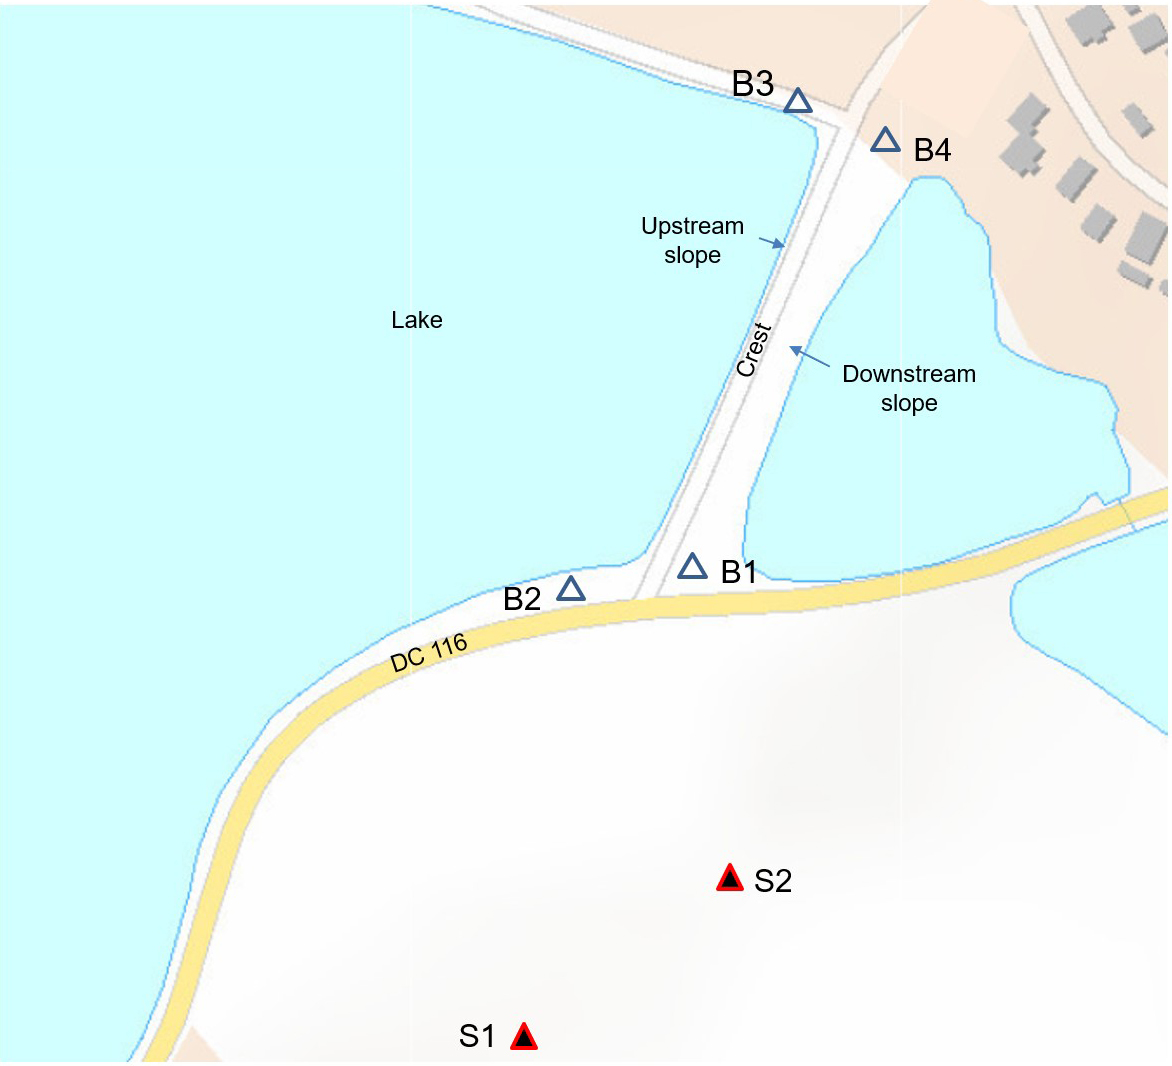
The designed local geodetic tracking network consists of the following components (Fig. 7):
- two reference points (S1, S2) located on the right slope in the vicinity of the dam;
- four station points (B1, B2, B3, B4) located near the dam, in stable areas.
The role of satellites is important in transmitting signals and these are received by measuring instruments (GNSS receivers). The receivers mounted on the dam structure decode the signal transmitted by the satellites and extract the information in order to determine the spatial position.
The measurement method consists in the relatively fast static positioning of high-performance GNSS receivers at the points located on the dam and the adjoining buildings, or on the territory adjacent to it. The relatively fast static method is the most expeditious GNSS method for high-precision positioning (Bond, 2008). GNSS measurements performed by the relatively fast static method are frequently used in the calculation of high-precision three-dimensional coordinates.
The measuring system provides coordinates with a precision of the order of millimetres, both horizontally and vertically. The stationary time of a work session was about 10 min. The duration of a measurement cycle depended on the number of receivers used and the distance between them.
For the Podisu dam, four Trimble GNSS receivers, three R8S receivers and one R2 receiver were used for the measurements. The control units used were a Trimble TSC3 and a Trimble Slate.
The geodetic network of the Podisu dam consists of points located in stable areas, outside the area of influence of the intended construction and also control points mounted on the body of the earth dam.
The services of the Trimble VRS Now system from the nearest permanent station, which provides real-time data, were used to determine the coordinates of the S1 reference point (Fig. 8). The S2 reference point was subsequently determined from the processing of static measurement sessions. The new points introduced in the geodetic network were marked with Bi (Fig. 8). Table 1 gives centralised coordinates of the reference points S1, S2 located outside the area of influence of the Podisu dam.
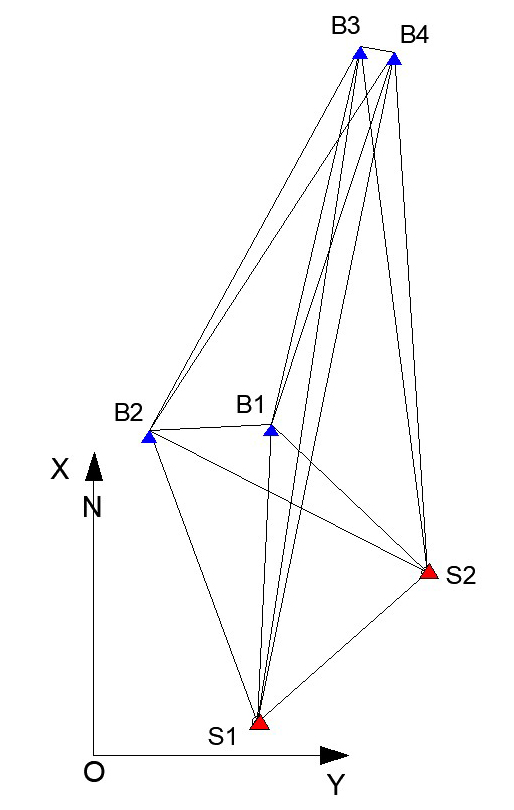
Figure 8 – GNSS Representation vectors in the monitoring network: red points – fixed reference points; blue points – new points in the local network
The coordinates for station points B1, B2, B3 and B4 were obtained in relation to points S1 and S2, as previously determined. Each observation session was performed by simultaneously measuring the pseudo-distance between the receivers used to the same satellites. Thus, the base vector between the stationary points was determined with GNSS equipment. It is defined by the relative coordinates ΔX, ΔY and ΔZ in the WGS84 system.
Table 1
Coordinates of control points
|
Point |
X (m) |
Y (m) |
Z (m) |
|
S1 |
641,134.388 |
656,110.094 |
107.643 |
|
S2 |
641,184.909 |
656,167.533 |
91.815 |
Straight segments that connect the stationary points according to the projected vectors represent the scheme of the observation sessions (Fig. 8). GNSS vector processing was performed automatically in the Trimble Business Centre program. In 2019 (cycle 0) there were 60 GNSS vectors and in 2021 (cycle 1) there were 36 GNSS vectors.
The differences (Di) between the two measurements of the points of the local monitoring network were processed and centralised in Table 2. From the data analysis, points B1 and B2 are the most stable, where the differences between the spatial coordinates are 1.6 cm at most.
In order to monitor the movements at the Podisu dam, four control points were monitored on the crest (P1-P4) (Fig. 9). At these points, rapid static GNSS observation sessions were conducted, with fixed stations at points B1 and B2, previously determined within the local geodetic tracking network.
To determine the control points (P1-P4), three series of measurements were performed, resulting in 18 GNSS vectors (Fig. 10). The spatial coordinates of the control points fixed to the crest of a dam, resulting from the two cycles of measurements performed in May and July 2021 were centralised in Table 3.
Table 2
Differences in coordinates and between cycle 0 and 1 measurements in the local tracking network
|
Point |
X (m) |
Y (m) |
Z (m) |
|
B1 2021 |
641,235.171 |
656,114.614 |
87.043 |
|
B1 2019 |
641,235.170 |
656,114.624 |
87.034 |
|
Di |
0.001 |
– 0.01 |
0.009 |
|
B2 2021 |
641,233.045 |
656,073.585 |
88.801 |
|
B2 2019 |
641,233.029 |
656,073.59 |
88.787 |
|
Di |
0.016 |
– 0.005 |
0.014 |
|
B3 2021 |
641,362.677 |
656,144.729 |
88.494 |
|
B3 2019 |
641,362.700 |
656,144.771 |
88.479 |
|
Di |
– 0.023 |
– 0.042 |
0.015 |
|
B4 2021 |
641,360.767 |
656,156.365 |
88.424 |
|
B4 2019 |
641,360.781 |
656,156.411 |
88.408 |
|
Di |
– 0.014 |
– 0.046 |
0.016 |
The analysis of the data from the two measurement cycles for the control points located on the dam crest shows a relatively low settlement between points P4 and P2. The differences recorded are 2.0 cm and 1.9 cm, respectively, between the two measurements. From the data processing, the horizontal displacements measured on the crest of the dam have a maximum values of 2.9 cm, at point P4.
The instability of the dam is also observed by changes in the structure of the downstream slope. Thus, the tracking system was completed with seven control points located on the downstream slope. The final monitoring system (Fig. 11) for the dam’s movements is composed of 11 control points, on which systematic observations can be made to follow the movements.
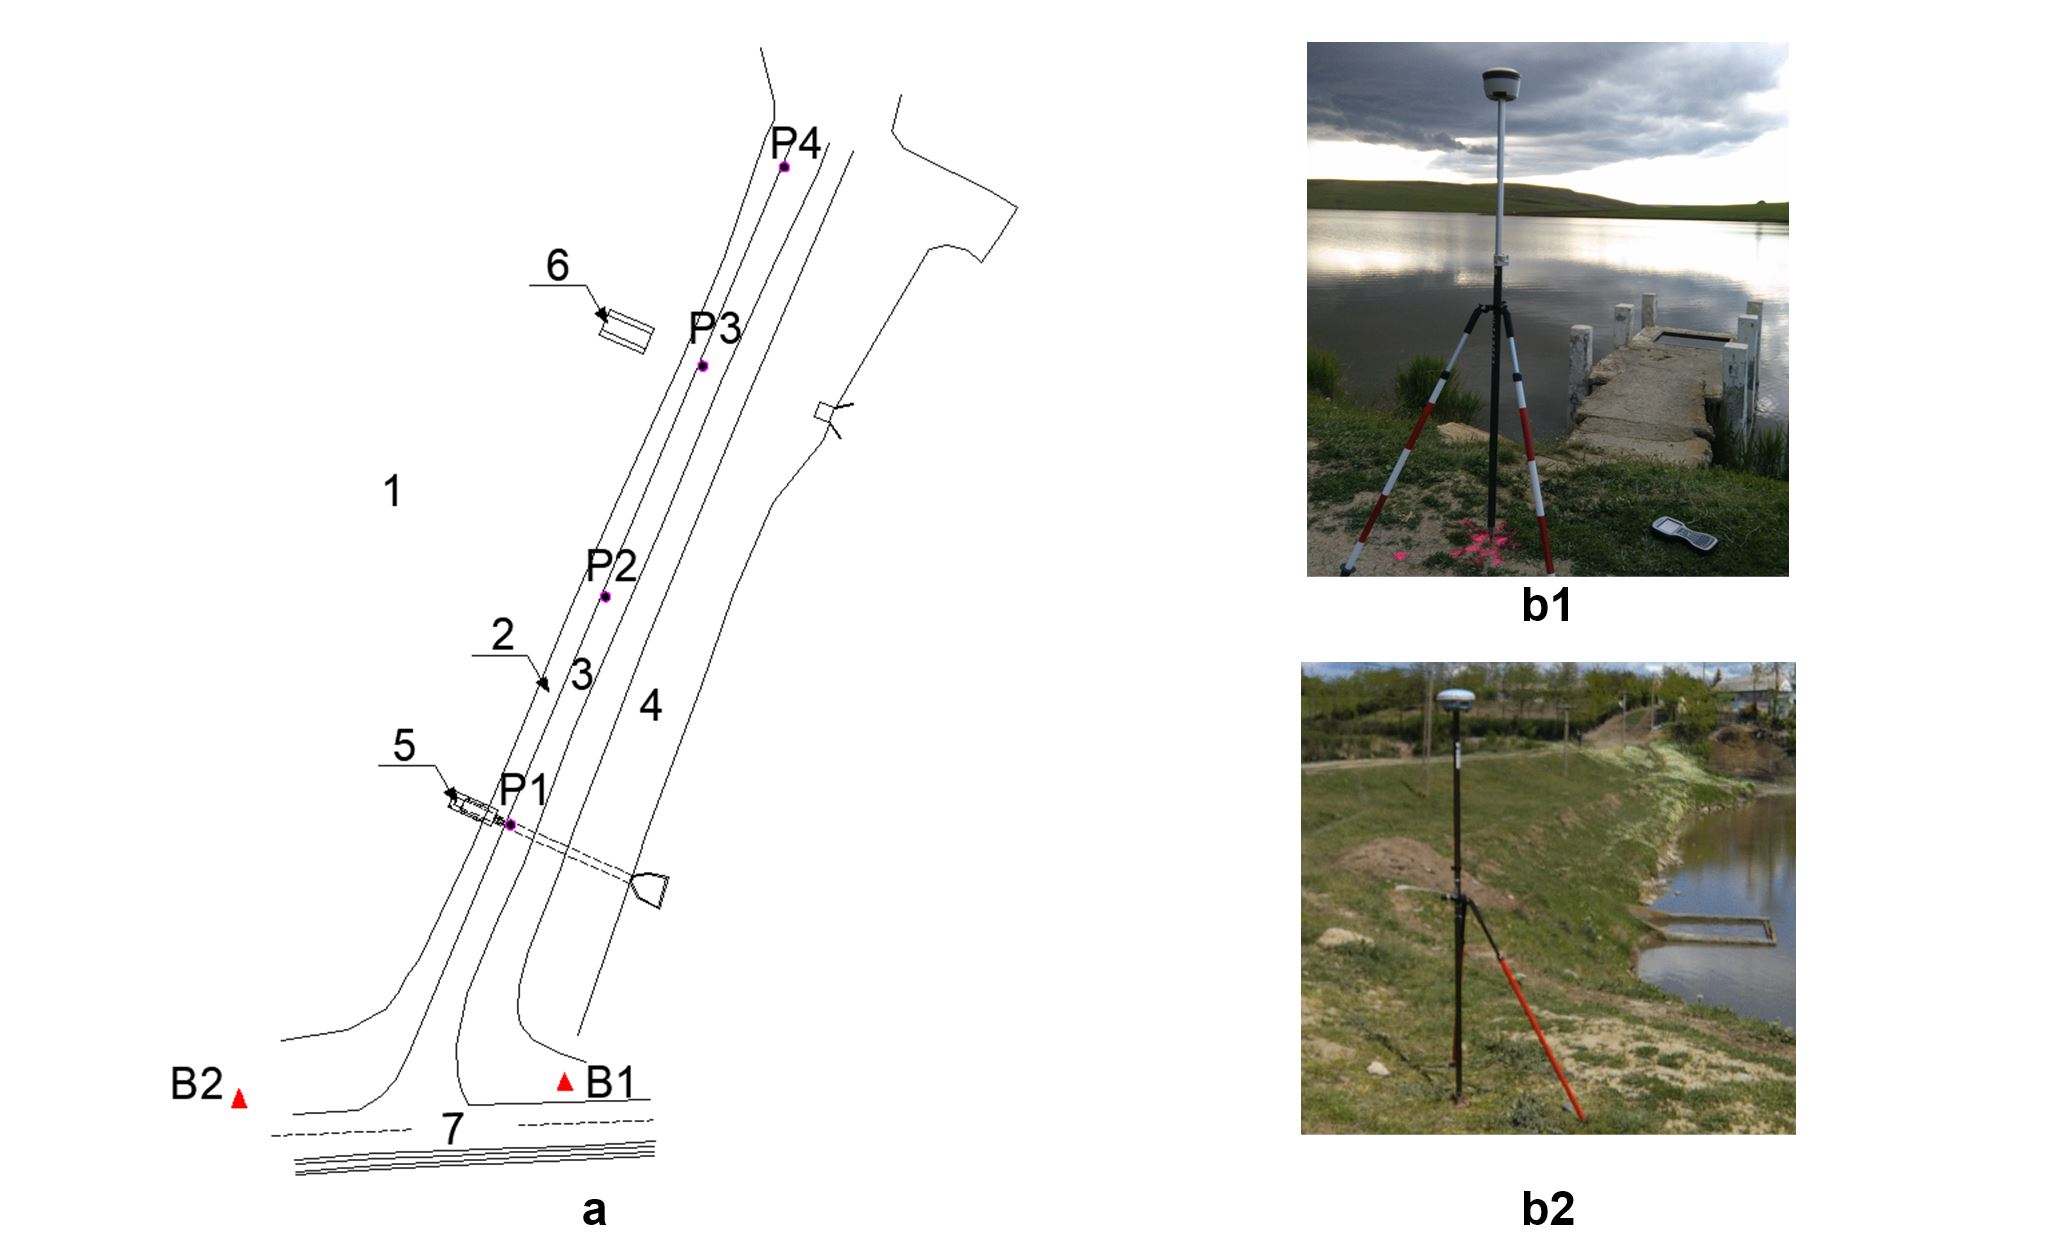
Figure 9 – Organisation and performance of measurements: a – dam representation scheme, 1 – water storage, 2 – upstream slope, 3 – dam crest, 4 – downstream slope, 5 – flow evacuation construction C1, 6 – flow evacuation construction C2, 7 – road; B1 and B2 – station points; P1, P2, P3, P4 – control points located on the dam crest; b – positioning the receivers: b1 – in control point P1, b2 – in station point B1.
Table 3
Measurement sheet of control points on the crest of a dam
|
Point |
P1 |
||
|
X (m) |
Y (m) |
Z (m) |
|
|
May 2021 |
641,266.2 |
656,107.827 |
87.936 |
|
July 2021 |
641,266.3 |
656,107.8 |
87.946 |
|
Di |
– 0.005 |
0.027 |
-0.01 |
|
Point |
P2 |
||
|
X (m) |
Y (m) |
Z (m) |
|
|
May 2021 |
641,294.9 |
656,119.769 |
87.909 |
|
July 2021 |
641,294.9 |
656,119.751 |
87.928 |
|
Di |
– 0.012 |
0.018 |
-0.019 |
|
Point |
P3 |
||
|
X (m) |
Y (m) |
Z (m) |
|
|
May 2021 |
641,323.8 |
656,131.983 |
87.853 |
|
July 2021 |
641,323.8 |
656,131.968 |
87.859 |
|
Di |
– 0.012 |
0.015 |
-0.006 |
|
Point |
P4 |
||
|
X (m) |
Y (m) |
Z (m) |
|
|
May 2021 |
641,348.7 |
656,142.257 |
87.994 |
|
July 2021 |
641,348.8 |
656,142.228 |
88.014 |
|
Di |
– 0.029 |
0.029 |
-0.02 |
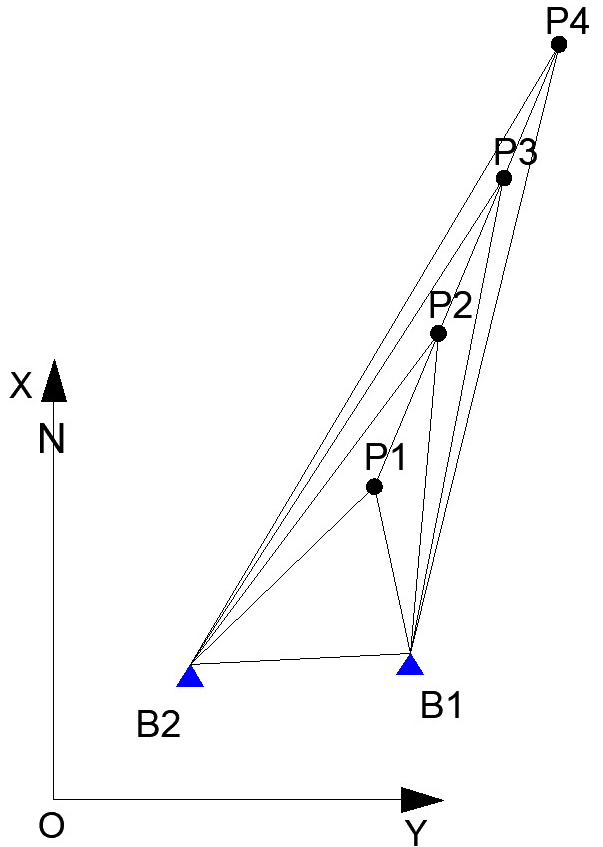
Figure 10 – GNSS vectors following the landmarks on the dam crest: B1, B2 – station points; P1, P2, P3, P4 – control points
In July 2021, a set of measurements was taken and the coordinates of the 11 control points fixed on the dam crest (P1 … P4) and the downstream slope (P5 … P11) were determined in relation to the station points B1 and B2 (Fig. 11).
Four Trimble GNSS receivers were used for field data collection and 10 measurement sessions were performed. The duration of a measurement session was about 11 minutes. During the processing of the measurements through the Trimble Business Centre program, 60 GNSS vectors were obtained (Fig. 12).
By processing the data, the coordinates of control points P1 … P11 (X, Y, Z) were obtained (Table 4). By statistical processing of the processed data, the standard deviations of the measurement errors Si were obtained (Table 5). Analysis of the data in Table 5 shows that the values of the standard deviation of the errors fall within the range 0.001 to 0.002 m.
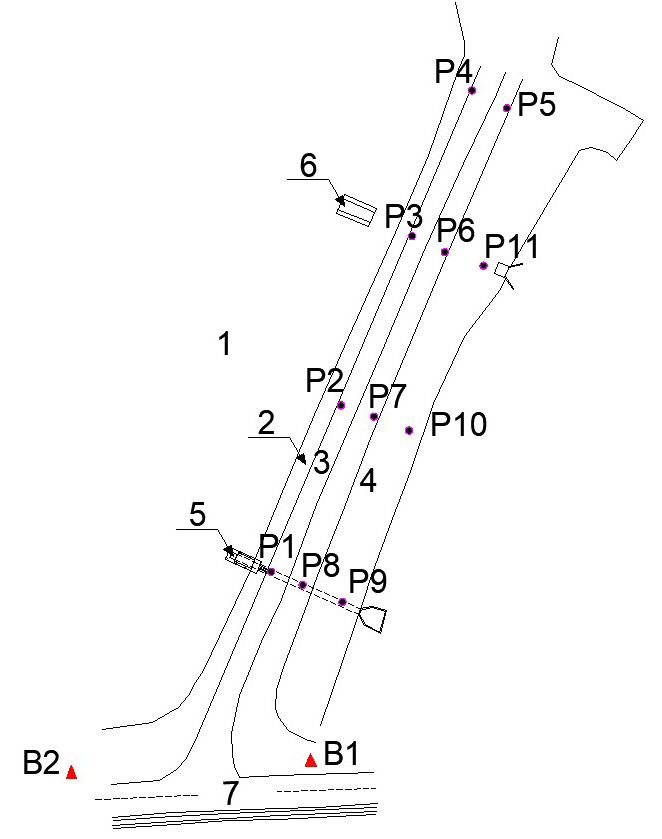
Figure 11 – Plan with control points on the dam crest and downstream slope: 1 – water storage; 2 – upstream slope; 3 – dam crest; 4 – downstream slope; 5, 6 – flow evacuation (C1, C2); 7 – road; B1, B2 – station points; P1…P4 – control points on the dam crest; P5…P11 – control points on the downstream slope.
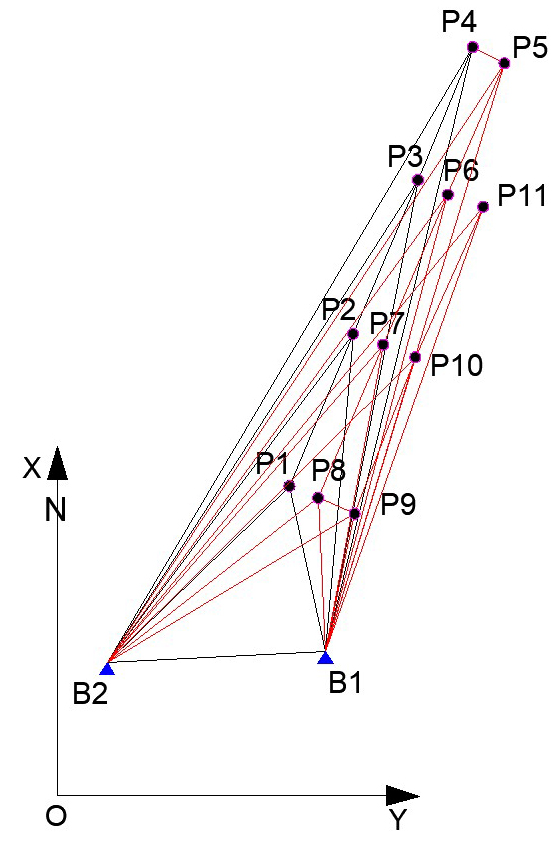
Figure 12 – The complete dam tracking network and GNSS vectors: B1, B2 – station points, P1…P4 – control points on the crest; P5, P11 – control points on the downstream face slope
The compensation of the monitoring geodetic network allowed the verification of the internal geometry of the network and the identification of possible errors that occurred in the measurement data.
The horizontal positioning components have an estimated standard deviation of up to 1.0 mm in the east (Y) direction and 2.0 mm in the north (X) direction. Vertical positioning components (Z) also have estimated standard errors of up to 2.0 mm.
Table 4
Measurement sheet of control points on the crest and downstream slope
|
Point |
Spatial rectangular coordinates |
||
|
X (m) |
Y (m) |
Z (m) |
|
|
P1 |
641,266.25 |
656,107.80 |
87.946 |
|
P2 |
641,294.87 |
656,119.75 |
87.928 |
|
P3 |
641,323.79 |
656,131.97 |
87.859 |
|
P4 |
641,348.77 |
656,142.23 |
88.014 |
|
P5 |
641,345.68 |
656,148.21 |
87.095 |
|
P6 |
641,321.01 |
656,137.56 |
86.443 |
|
P7 |
641,292.85 |
656,125.41 |
86.392 |
|
P8 |
641,264.01 |
656,113.21 |
86.987 |
|
P9 |
641,261.03 |
656,120.04 |
85.033 |
|
P10 |
641,290.45 |
656,131.47 |
84.969 |
|
P11 |
641,318.72 |
656,144.19 |
85.274 |
Table 5
Values of standard deviations of errors Si
|
Point |
Estimated standard errors |
||
|
Sx (m) |
Sy (m) |
Sz (m) |
|
|
P1 |
0.001 |
0.001 |
0.002 |
|
P2 |
0.001 |
0.001 |
0.002 |
|
P3 |
0.001 |
0.001 |
0.002 |
|
P4 |
0.001 |
0.001 |
0.002 |
|
P5 |
0.001 |
0.001 |
0.002 |
|
P6 |
0.001 |
0.001 |
0.002 |
|
P7 |
0.001 |
0.001 |
0.001 |
|
P8 |
0.001 |
0.001 |
0.001 |
|
P9 |
0.001 |
0.001 |
0.002 |
|
P10 |
0.001 |
0.001 |
0.002 |
|
P11 |
0.002 |
0.001 |
0.002 |
According to Munos and Calderon (2018), the distance between the control points and the reference points must be shortened in order to reduce the time occupied by the observation sessions. In the local monitoring network of the Podisu dam, this distance between the control points and the station points is less than 150 m and the distance between the station points and the reference points is less than 300 m. An observation session is in line with the empirical formula in the study by Andrei (2012). It was considered that for the baseline greater than 500 m, the time interval of the observation is given by the formula: 20min + 2min/km.
The organization of the travel measurement activity at the Podisu earth dam with GNSS technology is in accordance with the results obtained in the research conducted by Jamieson and Gillins (2018). They compare the accuracy of five online services (OPUS-S, AUSPOS, CSRS-PPP, GAPS and TrimbleRTX) in data transmission and processing. It also confirms the applicability and speed of Trimble software to data processing, a situation present in the Podisu Dam research.
The study by Corea-Munoz and Ceron-Calderon (2018) showed that there is no direct relationship between better accuracy and longer working times; nor did the time of day when the measurements were performed have a relevant effect on the results obtained with GNSS technology.
The use of GNSS technology to measure displacements in concrete dams has been tested and compared to classical geodetic methods by Chirilă et al. (2020). They performed measurements on the movements of a frontal overflow made of reinforced concrete. The resulting conclusions showed that both classical (angular) measurements and GNSS measurements (by pseudo-distance determinations) must be combined, so that positioning errors can be reduced.
The analysis of the results obtained by topographic measurements in the period 2020-2021 highlighted important changes in the geometry of the dam, compared to the initial design which was constructed. The following changes were highlighted:
– the shape of the dam in the cross section is changed from the original; the trapezoidal shape was transformed into a mixed-trapezoidal shape by the appearance of a berm on the downstream face slope;
– the downstream slope face has changed from 1: 2.0 (initially) to 1: 2.5 – 1: 3.5 as it is today;
– the slope of the upstream face is variable along the length of the dam, in the range 1.00 – 0.75, determined by the phenomenon of hydrodynamic erosion and the removal of the stone protection:
– the width of the crest of the dam has changed from 4.50 m (initially) to 3.81 – 4.92 m as it is today; the width is variable depending on the length of the crest of the dam.
The Podisu Dam was not chosen at random from the eight dams present on the Sheep Valley River. The selection criterion was given by the existence of technical documentation (technical expertise) with the characteristics of the hydrotechnical arrangement. The results obtained in the research confirm the need for topographic studies to be carried out at intervals during the operation of the dam. At the same time, the new structural condition of the dam must be verified by stability calculations.
The results of the measurements on the movements of the dam can be transmitted to the beneficiaries and the administration of water basins based on a service contract. The database obtained by measurements with GNSS technology can be used in earth dam stability checking programs.
The measurement of absolute displacements gives the most accurate picture of the dam’s behaviour (millimetre accuracy) (Sălăgean et al., 2015). The method of measurement has the disadvantage of a long time for making observations (days) and processing them by laborious calculations. In comparison, GNSS technology allows fast data retrieval in a much shorter time and at a relatively lower cost.
Monitoring of category C and D dams using state-of-the-art methods, applications and tools (GNSS systems, terrestrial laser scanners, drones etc.) is a necessity, given the absence of construction and slope adjacent monitoring and control equipment.
The adoption of a system for monitoring the movements of a category C and D earth dam located in a private operating system in Romania involves several technical, economic and legislative requirements. The dam administrator must build the material base of the monitoring system. The administrator must also hire a specialist firm to carry out topographic measurements and to set up the database. Solving the technical and economic requirements requires the elaboration of norms and laws that will realise the legal basis of the management of the dams in private exploitation system.
CONCLUSIONS
The use of modern GNSS technology to perform geodetic measurements at earth dams allows the rapid determination of the spatial position of the construction elements through vertical and horizontal vector components.
The research confirmed the applicability of the use of GNSS technology to measure displacements in category C and D earth dams in Romania which do not have a monitoring system, using the Podisu dam as a case study.
Our research shows the effective use of GNSS receivers for the rapid monitoring of a relatively large area of earth dams and its annexes, in order to obtain spatial coordinates with high accuracy and in a short period of time.
The development of a local geodetic network for measuring displacements at earth dams requires the positioning of station points and landmarks in accordance with the characteristics of the earth dam, as well as the equipment used in measurements with GNSS technology.
GNSS technology has a number of advantages over traditional monitoring techniques, in that the receivers can be used for continuous measurements, regardless of the time (day / night) and in various weather conditions, as demonstrated by the measurements made at the Podisu dam.
GNSS technology has the advantage that it does not require visibility between the measured points, because the accuracy of the determinations depends on the visibility of the satellites in the configuration of the satellite constellation, the reflection of satellite signals and the refraction phenomena in the ionosphere and troposphere.
The use of GNSS technology to monitor the Podisu earth dam in different weather conditions and the quality of the results obtained confirms the efficiency of the method in obtaining viable data in a relatively short time.
The adoption of the GNSS methodology for monitoring the movements in category C and D earth dams located in a private operating system in Romania implies the adoption of some technical, economic and legislative requirements.
Conflicts of interest. The authors declare that they have no competing interests.
REFERENCES
Agapie (Mereuță), I., Luca, M. (2020). Settlement monitoring of the earth dams by performance periodical topo-geodetic measurements. J. PESD, vol. 14 no. 1, pp. 99-109, doi.org/10.15551/pesd2020 141008.
Andrei, C.O. (2012). Cost – effective precise positioning using carrier phase navigation – grade receiver. In 2012 International Conference on Localization and GNSS, ICL-GNSS doi.org/10.1109/ICL-GNSS.201 2.6253132
Avram, M., Luca, M. (2017). Analysis of phenomena with hydrologic large risk in the hydrographic basin of the Trotuş River. J. PESD Vol. 11, no. 2 Publ.“Al. I. Cuza University of Iasi”, pp. 77-87.
Boboc, V., Mitroi, R. (2016). Modeling of earth dams failure. Scientific papers LSU Iasi, Agronomy series, vol. 59, no. 2, pp. 23-28.
Bond, J. (2008). Structural monitoring of the Mactaquac dam using GPS Sensors. Journal of Geodesy, 73, pp. 259-267.
Chirila, C., Casandrescu, I.A. (2015). Study on application of microtrilateration geodetic network for monitoring of hydrotechnical constructions. J. Rev-CAD, vol. 19, pp. 41-48.
Chirila, C., Siminicaru, B.P., Cucoară, C. (2020). Optimisation of measurements in the geodetic network for monitoring the horizontal deformations of the Rogojesti dam. Revcad, vol. 29, pp. 19-28.
Corea-Munoz, N.A., Ceron-Calderon, L.A. (2018). Precision and accuracy of the static GNSS method for surveying networks used in Civil Engineering. Ingeniería e Investigación, vol. 38, no.1, pp. 52-59. doi.org/10.15446/ing.inve stig.v38n1.64543
Hobjila, V., Luca, M. (2000). Complements regarding the design and expertise of some types of hydrotechnical constructions. Publ. CERMI Publishing House, Iasi, pp. 443-546.
Jamieson, M., Gillins, D.T. (2018). Comparative Analysis of Online Static GNSS Postprocessing Services. J. of Surveying Engineering, June, doi.org/10.1061/(ASCE) SU.1943-5428.0000256
Kalkan, Y. (2009). Monitoring Studies on Atatürk Dam Geodetic Methods. National Dam Safety Symposium, May 13-15, pp 239-250.
Levent, T. (2008). Dam deformation monitoring with GPS. Geodesy and Cartography, 34(4), pp.116–121.
Luca, A.L., Pop, O.A. (2016). Filtration process analysis – earth dams stability. Scientific papers. Serie E, Land Reclamation Earth Observation, & Surveying, Environmental Engineering. Vol. V, Publ. UASVM Bucharest, pp. 20-24.
Luca, M., Hobjila, V., Giurma, I. (1997). Technical expertise on the operational safety of the Varsolt dam. Poliascas Company, Iasi, Romania.
Luca, M., Hobjila, V. (2002). The hydraulic expertise of the high water discharge structure in earthen dams. Ovidius University Annals of Constructions, Constanza, Vol. 1, no. 3, 4, pp. 419-422.
Priscu, R. (1974). Hydro construction. Vol. II, Bucharest Didactic and Pedagogical Publishing House p. 758-817.
Salagean, T., Onose, D, Ortelecan, M., Sestras, P., Vele, D., Calin, M., Farcas, R. (2015). Aspects regarding the observations of vertical displacements of rockfill (riprap) dams. Scientific Papers. Series E. Land Reclamation, Earth Observation & Surveying, Environ. Engin., Vol. IV, Publ. UASVM Bucharest, pp. 165-170.
Sbiera, B. (2006). Expert documentation regarding the evaluation of the operational safety of the Podisu fish arrangement on the Sheep Valley River, Iasi county. WBA Prut-Barlad, Iasi, pp. 19-50.
Seyed-Kolbadi, S.M., Hariri-Ardebili, M.A., Mirtaheri, M., Pourkamali-Anaraki, F. (2020). Instrumented health monitoring of an earth dam. Research Gate, Infrastructures, vol. 5, pp. 1-12.
Tanasescu, M. (2018). Expert documentation regarding the reassessment of the operational safety of the Podisu water storage, Iasi county. WBA Prut-Barlad, Iasi, pp. 1-32.
Vele, D, Pop, I, Ortelecan, M, Salagean, T. (2014). Aspects regarding the monitoring of weight dams by geodetic measurements. RevCAD vol 17, pp. 161-168.
Wang, W., Chen, Z., Li, X. (2018). The arrangement of deformation monitoring project and analysis of monitoring data of a hydropower engineering safety moni-toring system. ICEESE 2017, IOP Conf. Series: Earth and Environmental Science, no. 128, pp. 1 – 8. doi :10.1088/1755-1315/128/1/012006
*** ICOLD (1995). Dams Failures Statistical Analysis, Buletin 99.
*** NTLH-022 (2002). Methodology regarding the categories of importance of dams. Publ. M. O. part I, Year XIV, no. 427, Bucharest.
*** NTLH-021 (2002). Methodology for assessing the operational safety of dams and reservoirs. Publ. M. O. part I, Year XIV, no. 427 Bucharest.
*** WBA (Water Basin Administration) Prut – Barlad, Synthesis reports 2006 – 2018, Iasi, Romania.
*** Trimble GNSS Planning Online.
Agapie Ioana, Dominte Violeta, Gherasim Paul-Marian, Luca Mihail

