Ana Machidon
ABSTRACT. The production of the sugar beet in the Republic of Moldova (RM) in the last ten years decreased considerably. The world and Moldovan sugar consum-ption is increasing, therefore making sugar beet an important crop for sugar production. Sugar beet production, as one of the main industrial crops with a significant share in earnings, has an impact on the manufacturing sector of the country. Based on the crop significance, the scope of this research is to forecast the sugar beet production. Five years of forecast were computed for sugar beet production (Yt) in the RM. The research was conducted by the help of data provided by the National Bureau of Statistics. Six time series models were run to find the best solution for Yt forecast. Three of the models were considered the most appropriate. These are: Exponential function trend, Quadratic function trend and Holt’s method. The AIC (Akaike Information Criterion), SBC (Schwarz Bayesian Criterion) and R2 (coefficient of determination) explained that 77,5% of data showed to be optimal for Yt forecast in Holt’s method. As a result, the forecast was based on Holt’s methodology for time series with trend. Consequently, it was found that Yt will decrease by approximately 15 thousand tonnes by 2022. However, as the data is based on past assumptions, there still exists hope that the production of sugar beet will increase. The same is considered for the average yield, which at the moment is twice lower than in the European Union countries.
Keywords: forecasting methods; time series; trend; raw material; sugar.
View full article (HTML)
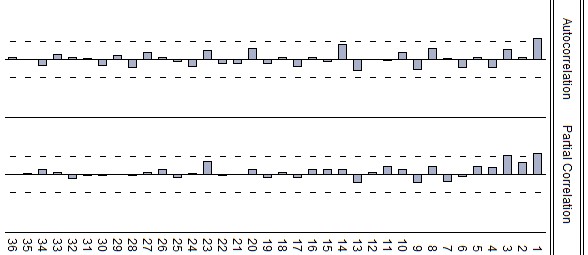
Figure 3 – First diference autocorelation and partial corelation for sugar beet production
The sugar beet production forecast in the Republic of Moldova
Figure 3 – First diference autocorelation and partial corelation for sugar beet production
Ana Machidon1
1Warsaw School of Economics, Collegium of World Economy, Warsaw, Poland
*E-mail: machidon_ana@yahoo.com
Received: June 22, 2018. Revised: Sept. 27, 2018. Accepted: Nov. 19, 2018. Published online: Oct. 10, 2019
ABSTRACT. Complex investigation on the effect of Thiourea, Galmet and Thiogalmet compositions on water status, intensity of photosynthesis, water use efficiency, growth and yield of ‘P458’ maize plants under conditions of natural humidity in field trials was performed. The beneficial effect of seed and foliage pre-treatment with Thiourea, Galmet and, in particular, the new chemical composition Thiogalmet on plants’ biological processes conditioning a better realisation of the physiological processes associated with plant growth and productivity was established. A significantly greater positive impact of Thiogalmet on the optimisation of hydration degree, water retention capacity, stomatal conductance for CO2/H2O, assimilation, water use efficiency, plant growth and productivity was recorded. There was an additive action of Thiourea and Galmet in the composition of the Tiogalmet preparation. Thiogalmet increased the yield per unit area and improved the commercial quality of the grain. Treating plants with Thiourea, Galmet and Thiogalmet ensured a 27.20, 52.08 and 68.20% yield increase, respectively, compared to the plants in the control variant. Therefore, a major effect was registered in the plants treated with the new composition. The obtained information demonstrates the possibility of mitigating the adverse effects of drought on the physiological response and production by applying antioxidants.
Keywords: growth; photosynthesis; physiologically active substances; plants; productivity; resistance; transpiration.
INTRODUCTION
The earliest sugar beet crop began to be grown for more than 2000 years ago, and the fact that beet roots contained sugar was discovered in 1705 by Oliver de Serres (Austin, 1928). In today, industry sugar beet together with sugar cane constitutes the two main raw materials for producing particularly sugar. Sugar consumption in the world is increasing and there is no sign of its decrease in the future. Consequently, the global stocks for sugar decrease, objectifying the necessity to cultivate sugar crops.
For example, in 2016, world consumption grew by 2.26% and by the end of the year world stocks of sugar reduced by 2.294 mln tonnes, to 108.738 mln tonnes (Sugar Year Book, 2017).
For the Republic of Moldova, sugar beet is characteristic as a raw material used for sugar production. Two main producers of sugar: “Sudzucker Moldova” (two factories) and “Moldova zahar” (one factory) help to meet the growing sugar demand. Specific is that sunflower, vineyards, fruit and sugar beets are important industrial crops, that have a major share in foreign currency earnings (Arya et al., 2007).
Thus, for Moldova, sugar beet is one of the crops which production could be increased and competes within the international sugar trade. Faced up to these the facts, in the last 20 years, production decreased twice and is three times lower than in the last 35 years. And that manufacturing sector cannot continue to expand for long without a balanced expansion in the output of the agricultural sector (Myint, 1980).
In authors opinion, it is consi-dered that the importance of the production in agriculture is primordial for the development of the economy. Therefore, the forecast of sugar beet production will definitely have a high impact on the manufacturing sector of the Republic of Moldova, as well as on its economic development and as an orientation direction for future trends.
To forecast the production of different technical goods till the present moment in the literature there where used numerous quantitative methods varying from time series methods to causal methods. For example, Řezbová et al. (2013) are suggesting Simple Regression in fore-casting production of sugar beet in the European Union.
Iqbal et al. (2016) are forecasting wheat production by the help of Autoregressive Integrated Moving Average model.
Karadas et al. (2017) apply Exponential Smoothing methods to forecast production of some oil seed crops in Turkey. Akay et al. (2017) are forecasting grain species, like wheat, rice and rye by using Time Series analysis including the Box-Jenkins method. Janjua et al. (2010), in demonstration of the Impact of Climate Change on Wheat Production for Pakistan is forecasting wheat production in 2060 using Vector Auto Regression (VAR) model, based on factors like temperature, carbon dioxide, precipitation, etc. Just because there are a lot of factors influencing the production, to limit the research on one factor or on some several, would influence too much the forecast based on a specific factor. Thus, it is considered appropriate to use the time series methods for the research.
As a raw material to produce especially sugar, sugar beet production is of special importance in satisfying the supply, demand and in improving the manufacturing sector. Considering it relevant to be fore-casted by choosing the appropriate time series methods, the aim of the current study is to forecast and observe the trend for the sugar beet production in the Republic of Moldova.
MATERIALS AND METHODS
In order to forecast the production of sugar beet in the Republic of Moldova for the years 2018-2022 there were used yearly data published by the National Bureau of Statistics of the Republic of Moldova on the production of sugar beet (thousand tonnes) from 1980 to 2017. Time series methods were used to forecast the sugar beet production. Generally, a time series {x(t),t = 0,1, 2,…} is assumed to follow certain probability which describes the joint distribution of the random variable xt (Adhikari and Agrawal, 2013).
In time series analyses, exponential smoothing proved through the years to be very useful in many analyses. These methods originated in the 1950’s and 1960’s with works of Holt (1957) and Winters (1960) among other writers (Bleikh and Young, 2014).
The forecast which is performed is a long term forecast, thus the forecasted period being equal to five years. The chosen method, which fit the data, is Holt’s method. Holt’s two parameter technique is a technique which includes trend effects in forecasting (Bajpai, 2009). The method involves the calculation of the level of the trend (Lt) and the trend change (Tt), which are computed as follows (Albright and Winston, 2015):
Lt = αYt + (1 – α)(Lt-1 + Tt-1) (1)
Tt = β(Lt – Lt-1) + (1 – β)Tt-1 (2)
Thereby the forecasted value for k periods is computed next (Albright and Winston, 2015):
Ft+k = Lt + kTt (3)
Holt’s method uses two smoothing constants α and β . These two weights can be the same or different. Higher values of α and β will give more emphasis on recent values (Bajpai, 2009). The values of the smoothing constants should be ranged between 0 and 1.
In addition to Holt’s method, for comparison of the forecast accuracy and model fitting there were assumed trend functions (by Least Square Method), as follows:
Linear: Yt = a + b * t + εt (4)
Polynomial (Quadratic): Yt = a + b * t + c * t2 + εt; (5)
Exponential: Yt = ea+bt + εt (6)
Logarithmic: Yt = blnt + aεt (7)
Power: Yt = a*tbεt (8)
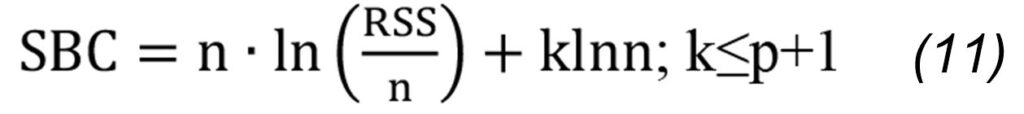
In finding the best model fitting the data, there were used the coefficient of determination (R2), Akaike (AIC, 1973) and Schwarz Bayesian Criteria (SBC, 1978).
The coefficient of determination is calculated by dividing the “explained sum of squares” to the “total sum of squares”, as follows:
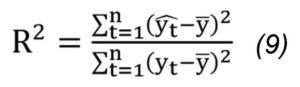
By construction, 0≤ R2 ≤1. A perfect fit is attained for R2=1and the worst possible fit (which is not fit at all) is obtained when R2=0 (Watson and Teelucksingh, 2002).
The Criteria:
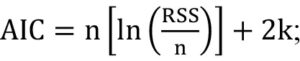
n is the sample k-number of parameters, RSS-residual sum of squares (10)
For the distribution of the fitting error (et) the DW (Durbin and Watson, 1950; 1951), statistics and Run test (Wald and Wolfowitz, 1943) is computed.
Durbin Watson test is one of the most used test for testing the type of autocorrelation existence of the residuals. Thus it calculates the upper and lower significance bounds (d(u) and d(l)) for different combinations of n, the number of sample points and k, the number of explanatory variables excluding the constant term.
The DW formula is as follows:
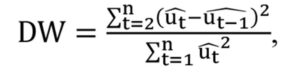
where ut = residual term; DW’= 4-DW (12, 13)
If DW<dl(value 2), there is positive autocorrelation; If DW’<dl, there is negative autocorrelation;
If DW> du(value 2), there is no autocorrelation; If DW’> du, there is no autocorrelation (Watson and Teelucksingh, 2002).
The Run test is executed in order to test whether the residuals are random. First of all the numbers of runs (R, n(1), n(2)) are computed, followed by the mean (μR) and variance () and the test statistic (Z value), thus comparing Z value with the rejection region.
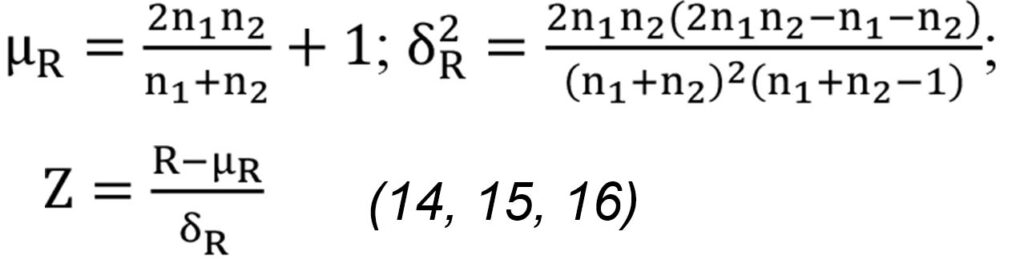
Rejection region:
|Z| > Zα/2 (Ramachandran and Tsokos, 2009) (17)
Eviews 10 software and Microsoft Office Excel 2007 have been used in computing the methods and getting the results.
RESULTS AND DISCUSSION
In the Republic of Moldova, sugar beet production decreased considerably in the last decades. Thus, if in 1980 the total production was equal to 2726 thousand tonnes, in the last three years it accounts for an average of 693 thousand tonnes (Table 1). With these decreases, for the Republic of Moldova to succeed in the international market it should be drown a considerable attention to the continued development of the sugar beet crop extension.
As it is shown by the figures of the Sugar Net Trade, which define a positive tendency toward export except in 2013. This positive tendency as well leads to an increase/decrease in Gross Domestic Product. Another fact is that even if in the last years the average yield of sugar beet increased by 44%, in comparison to 1980, still the level of the Republic of Moldova yield production is far away from the one obtained by the EU countries, which is twice higher than the Moldova’s (Table 1). This is a question mark, which also needs to be redressed, especially from the technological point of view, but first of all it is important to proceed to the data researched as these allow determining the future decisions.
The time series researched (Fig. 1) consists of a decreasing trend with the presence of the irregular fluctuations around it.
Thus, Yt (data) = Tt (trend) + Et (irregular fluctuations). That is why it is going to be used methods for time series with trend. This means that this is not a stationary time series, and that the trend will have an important effect on the value forecasted.
The non stationary feature of the time series could be seen also by analyzing the Autocorrelation and Partial Autocorrelation (Fig. 2). There is a high level of autocorrelation between the values at 5% confidence level, as the coefficients are out of the confidence interval lags 1-8 positive and 19-27 negative autocorrelation.
Table 1
Average yield, Sugar Beet Production and Sugar Net Trade during 1980, 2013-2017 in the Republic of Moldova
| Year/Indicator | 1980 | 2013 | 2014 | 2015 | 2016 | 2017 | |
| Average yield (q/ha) | MD | 256 | 356 | 499 | 253 | 326 | 370 |
| EU | 302 | 572 | 619 | 557 | 603 | – | |
| Sugar Beet Production (K, t) | 2726 | 1009 | 1356 | 538 | 665 | 876 | |
| Sugar Net Trade (M, t) | – | -7,396 | 77,207 | 59,566 | 34,765 | – | |
Source: FAOSTAT Data, NBS Moldova, http://www.fao.org/, www.statistica.md; (Sugar Yearbook, 2017).
MD=Moldova, EU=European Union, q/ha=quintals/hectare, K, t=Thousand tonnes, M, t=Metric tonnes, FAOSTAT=Food and Agriculture Organization Corporate Statistical Database; NBS=National Bureau of Statistics.
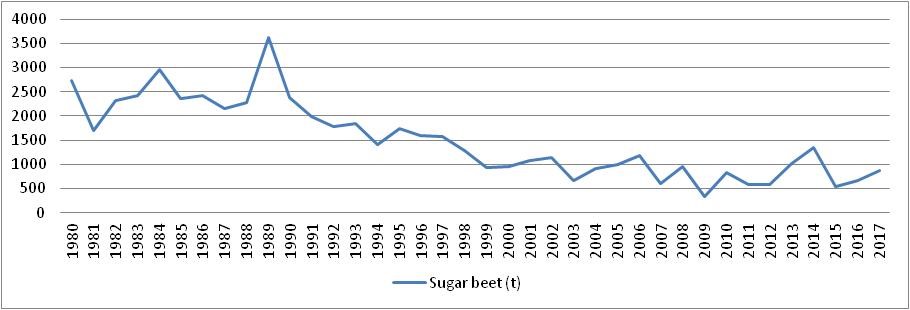
Figure 1- Yearly sugar beet production in the Republic of Moldova (1980-2017)
In analyzing time series it is important to assume that it is stationary. Thus, autocorrelation and partial autocorrelation by the first difference (Fig. 3) confirm the close-ness of the time series to the stationary one. Only for the first lag it is seen a small deviation. Therefore, based on the trend characteristics of the analyzed time series, it was appropriate to consider the attempts to fit it by a set of trend functions. The trend functions include Exponential, Linear, Polynomial, Logarithmic and Power function (Fig. 4). Together with the described functions there were performed also Holt’s method for time series with trend (Fig. 4).
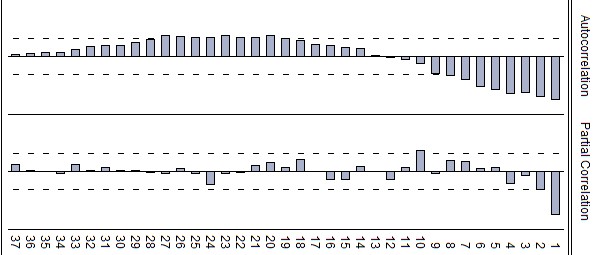
Figure 2 – Autocorelation and Partial Corelation for sugar beet production
The trend models were analyzed by Akaike, Schwarz Criterion and R2 as well. Thus, the best fit models based on R2 are: the Polynomial (0.732), Exponential (0.722), and Holt’s method (0.775) (Table 2).
The best values of the AIC and SBC are found in Exponential trend and Holt’s methodology. In Holt’s method it is visible that 77,5% of data is explained by the model, in contrast to 72,2% for the Exponential Trend.
Table 2
Model selection criteria
|
Model/Criterion |
Exponential |
Linear |
Polynomial |
Logarithmic |
Power |
Holt |
|
AIC |
12.085 |
14.983 |
14.959 |
15.320 |
13.050 |
12.431 |
|
SBC |
12.223 |
15.069 |
15.088 |
15.406 |
13.189 |
12.484 |
|
R2 |
0.722 |
0.717 |
0.732 |
0.604 |
0.570 |
0.775 |
AIC= Akaike Information Criterion, SBC= Schwarz Bayesian Criterion, R2= coefficient of determination.
In this respect, the Holt’s methodology is used to forecast the next 5 years of sugar beet production. By minimizing the RMSE (Root Mean Squared Error), the coefficient of level of the trend is α = 0.6707 and trend change is β = 0.1781. By analy-zing the level of accuracy, it is seen that MAPE (Mean Absolute Percentage Error) is ≤100%, which mean that the prediction level of accuracy is accurate.
Analyzing the residuals (et) by distribution, these seems to be random, and stationary, normally distributed. This is confirmed as well by the autocorrelation and partial correlation function of the residuals (Fig. 5). Thus, to ensure the truthfulness of its randomness the specific tests were taken.
In order to assess the fitting error DW test is calculated and the Run test is done. Thus, the DW is equal to 1.90, which means that there is lack of serial autocorrelations. The critical values of DW are equal to d1=1.427; d2=1.535; d3=2.465; d4=2.573. The run test indicate a value of Z=1.094766, which is smaller than 2, thus confirming the randomness of the errors.
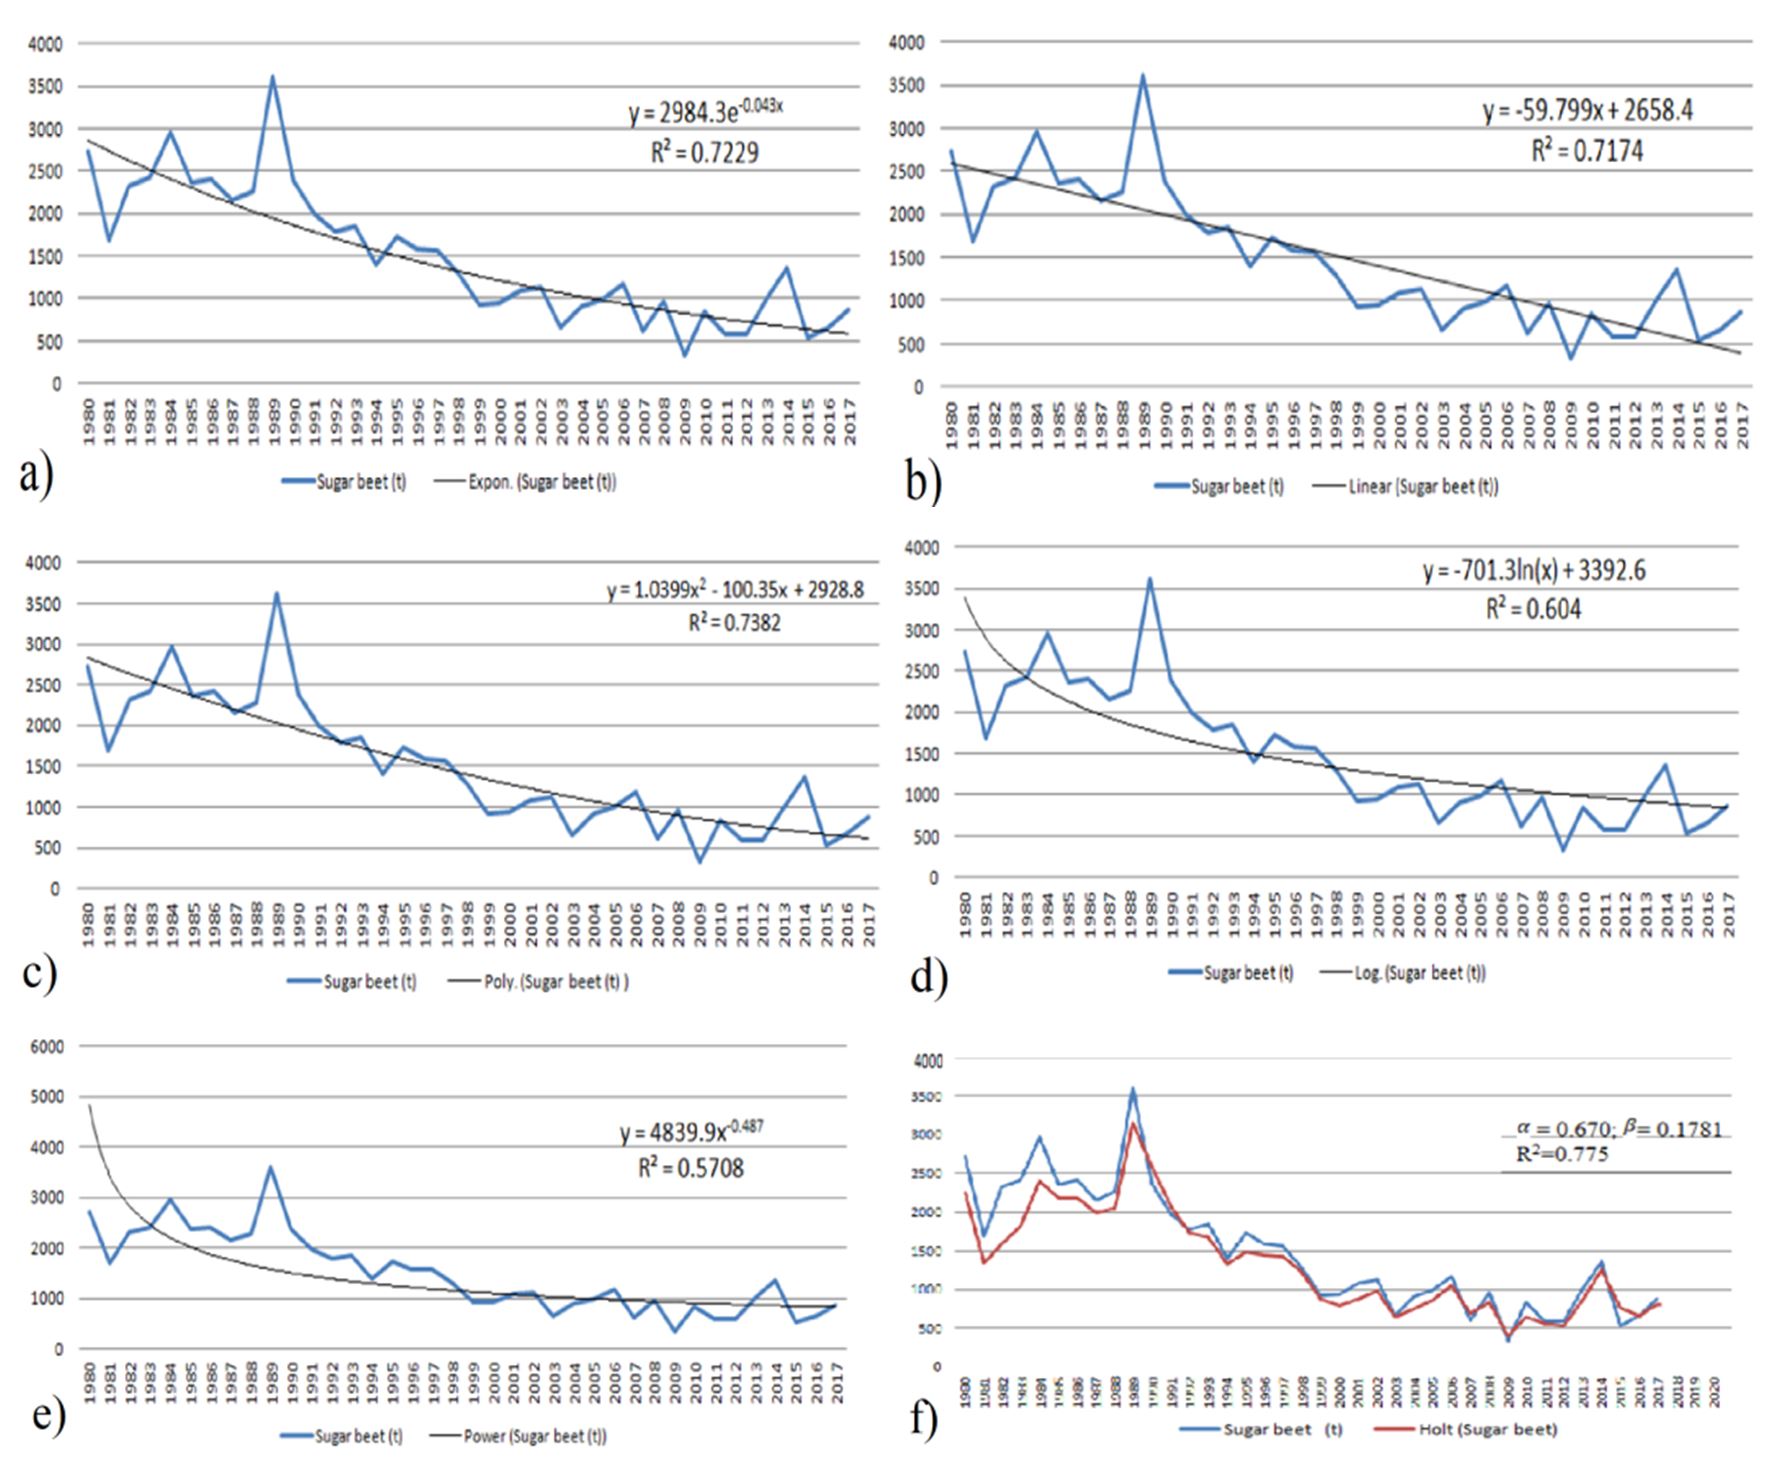
Figure 4 – Exponential (a), Linear (b), Polynomial (c), Logaritmic (d) and Power(e) trend functions, Holt’s method (f) and determination coeficient for sugar beet production
As a result the forecast of the sugar beet production (Ft) is computed for 2018-2022 (Fig. 6). Thus, the forecasted values of production for sugar beet for the next five years indicate a slight increase, in comparison to the last year (2017) and, respectively, followed by a trend decrease. Thus, according to the Holt’s methodology, the forecast for 2018 is 803.488 thousand tonnes, 2019 is 799.717 thousand tonnes, 2020 is 795.946 thousand tonnes, 2021 is 792.174 thousand tonnes, and for 2022 is 788.403 thousand tonnes. An argument in favour for choosing the Holt’s methodology is that α and β in case of any unexpected fluctuations occur, could be easily changed and managed based on the model, and a new forecast could be run.
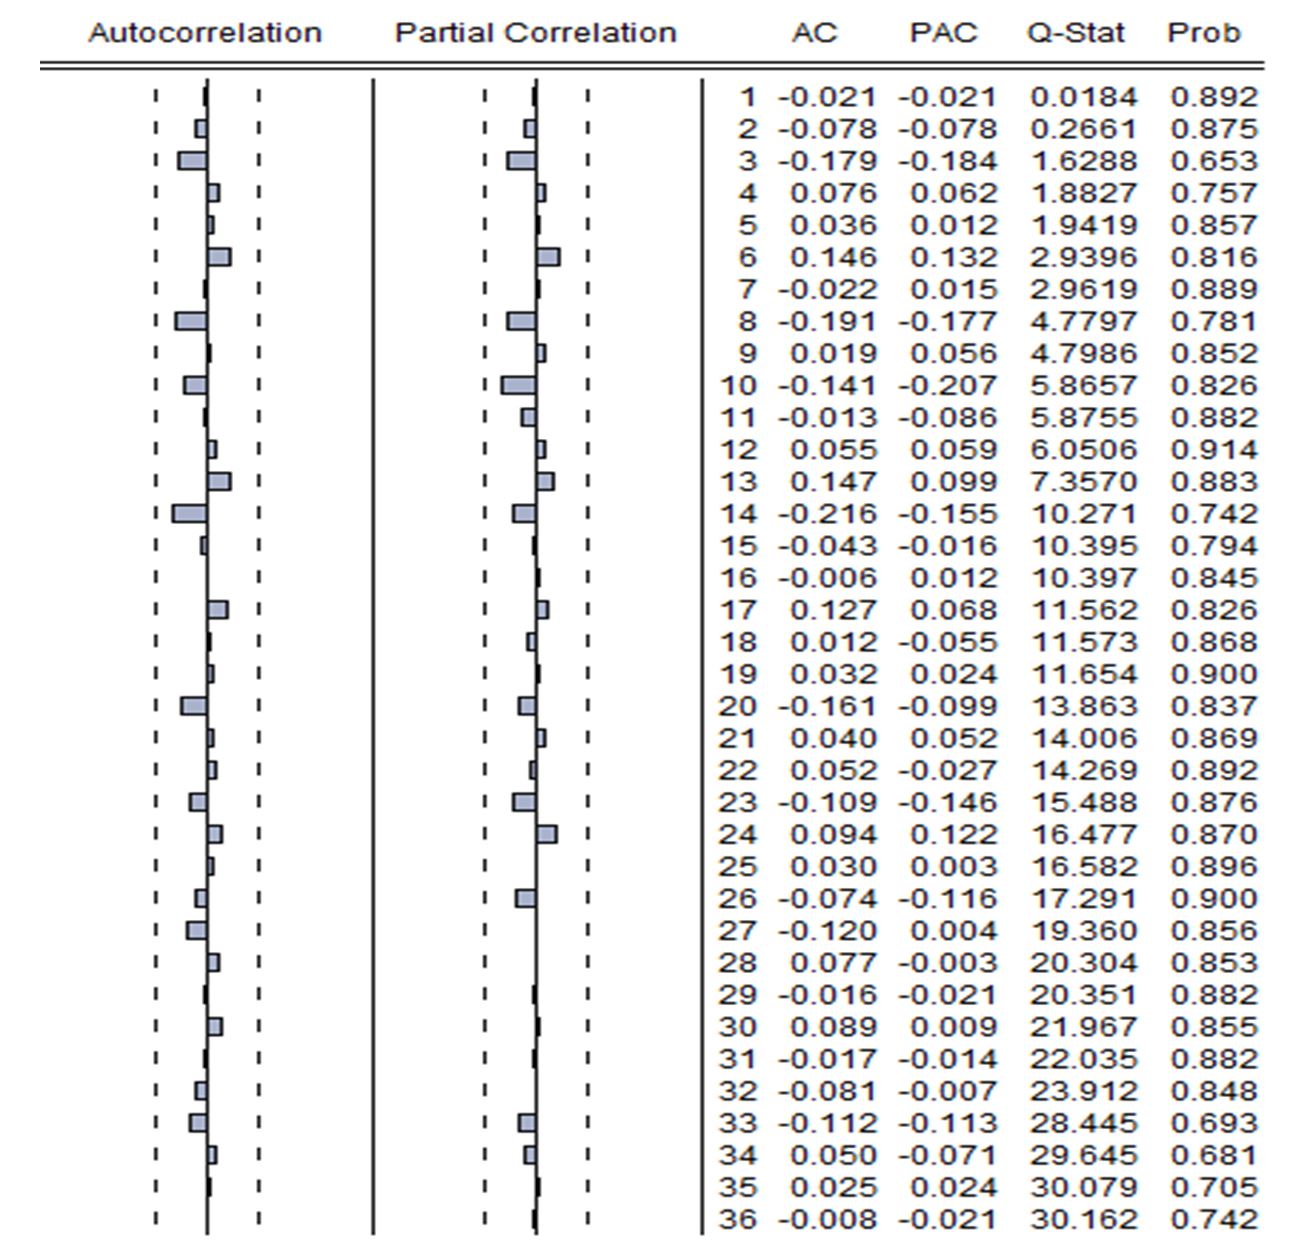
Figure 5 – Residuals Autocorrelation and Partial Correlation
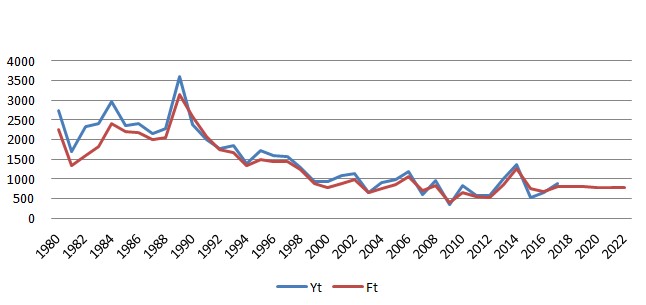
Figure 6 – The actual sugar beet production (Yt) and the forecasted value of sugar beet production (Ft)
CONCLUSIONS
As a result of the research it could be concluded that sugar beet production during the next five years will decrease and range between 790-800 thousand tones. In predicting it, the best methodology proved to be Holt’s method for time series with trend. The decreased production would influence the development of the economy, thus state institutions and private sector would be welcomed in regulating the market at least at EU countries average yield level.
Thereby, further research is needed in the related sectors.
REFERENCES
Adhikari, R. & Agrawal, R.K. (2013). An Introductory Study on Time Series Modeling and Forecasting. Lambert, Academic Publishing, Germany, 68:15.
Akaike, H. (1973). Information theory and an extension of the maximum likelihood principle. 2nd International Symposium on Information Theory, Tsahkadsor, Armenia, USSR, Sept. 2-8, Eds. B. N. Petrov and F. Csáki, Budapest: Akadémiai Kiadó, pp. 267-281.
Akay, Ö., Bozkurt, G. & Yüksel, G. (2017). Prediction of grain products in Turkey. Journal of Mathematics and Statistics. Science Publications, 13 (3): 220.230, DOI: 10.3844/ jmssp.2017.220.230.
Albright, S.Ch. & Winston, W.L. (2015). Business analytics: data analysis and decision making. Cengage Learning, USA, 990:629.
Arya, A., Josserand, H., Niazi A. & Rebello G. (2007). FAO/WFP crop and food supply assessment mission to Moldova. Special report, Rome, 31: 9.
Austin, A.H. (1928). History and development of the beet sugar industry. 1180 National Press Building, Washington, D.C., 35:11.
Bajpai, N. (2009). Business statistics. Pearson Education, Delhi, India, 761:592.
Bleikh, H.Y. & Young, W.L. (2014). Time series analysis and adjustment, measuring, modeling and forecasting for business and economics. Gower Publishing, United Kingdom, 133:7.
Durbin, J. & Watson, G.S. (1950). Testing for serial correlation in least squares regression, I. Biometrika, 37(3-4): 409-427, Oxford University Press, DOI: 10.2307/2332391
Durbin, J. & Watson, G.S. (1951). Testing for serial correlation in least squares regression, II. Biometrika, 38(1-2): 159-178, Oxford University Press, DOI: 10.1093/biomet /38.1-2.159
Holt, C.C. (1957). Forecasting seasonals and trends by exponentially weighted moving averages. Pittsburgh, PA: Carnegie Institute of Technology, Graduate school of Industrial Administration, O.N.R. research memorandum, 52.
Iqbal, M.Ch., Tariq, M.J., Qaisar, A. & Rashid, A. (2016). Forecasting of wheat production: a comparative study of Pakistan and India. IJAR, 4(12): 678-709.
Janjua, P.Z., Samad, G., Khan, N.U. & Nasir, M. (2010). Impact of climate change on Wweat production: a case study of Pakistan. The Pakistan Development Review, 49(4 II): 799-822.
Karadas, K., Çelik, Ş., Eyduran, E. & Hopoğlu, S. (2017). Forecasting production of some oil seed crops in Turkey using exponential smoothing methods. The J.Anim.Plant Sci., 27(5): 1719-1729.
Myint, H. (1980). The economics of the developing countries, 5th edition. London: Hutchinson, Great Britain, 166:111.
Ramachandran, K.M. & Tsokos, C.P. (2009). Mathematical statistics with applications. Elsevier Academic Press, USA, 803:654.
Řezbová, H., Belová, A. & Škubna, O. (2013). Sugar beet production in the European Union and their future trends. Agris on-line Papers in Economics and Informatics, 5(4): 165-178.
Schwarz, G.E. (1978). Estimating the dimension of a model. Ann. Statist., 6 (2): 461-464.
Sugar Yearbook (2017). International Sugar Organization (ISO)
Wald, A. & Wolfowitz, J. (1943). An exact test for randomness in the non-parametric case based on serial correlation. Ann.Math.Statist., 14(4): 378-388.
Watson, P.K. & Teelucksingh, S.S. (2002). A practical introduction to econometric methods: classical and modern. The University of the West Indies Press, 305: 27, 71,72.
Winters, P.R. (1960). Forecasting sales by exponentially weighted moving averages. Manage.Sci., 6(3), 324-342, DOI: 10.1287/mnsc. 6.3.324.
Machidon Ana

© by the authors; licensee Journal of Applied Life Sciences and Environment, Iasi, Romania. This article is an open access article distributed under the terms and conditions of the Creative Commons Attribution License (http://creativecommons.org/licenses/by/4.0)
