A.I. Ibrahim, M.A. Yousry, M.I. Saad, M.F. Mahmoud, Maysa Said, A. Ameen
ABSTRACT. Grains of field crops, such as wheat, maize, faba bean and white bean, are considered strategic food for humanity worldwide and Egypt. Unfortunately, percent losses of grains quantity may reach to 15-30%, as a result of stored product insect damage, and the losses increased dramatically in the last years, as an outcome of quickly productions of these pests. Experiments were conducted on infrared thermal imaging that demonstrate early detection of infestation by stored product insects in wheat, maize, broad bean, white bean and bean grains. The imaging is dependent on subtle significant differences in temperature between infested and healthy grains. Because the thermal imaging data are digital, computer programs can be used to analysis differences in temperature and mining figures explained for that. Results revealed that the use of thermal imaging offers an alternative method to detect an insect infestation. Data concluded that thermal imaging has the potential to identify whether the grains of crops that tested are infested or not, but is less effective in identifying which developmental stage is present. Moreover, it could apply this technique easily on a large scale in silos, storage, mills and granaries without negative impact on quality of stored grains.
Keywords: thermal camera; pulses; grains; insects.
View full article (HTML)
Infrared thermal imaging as an innovative approach for early detection infestation of stored product insects in certain stored grains
A.I. Ibrahim1*, M.A. Yousry1, M.I. Saad1, M.F. Mahmoud1*, Maysa Said2, A. Ameen1
1Plant Protection Dept., Faculty of Agriculture, Suez Canal University, Ismailia, Egypt
2Agricultural Research Station, Barley Research Dept., Ismailia, Egypt
*E-mail: mfaragm@hotmail.com; mfaragm@agr.suez.edu.eg
Received: Dec. 13, 2019. Revised: Feb. 03, 2020. Accepted: Feb. 07, 2020. Published online: Mar. 06, 2020
ABSTRACT. Grains of field crops, such as wheat, maize, faba bean and white bean, are considered strategic food for humanity worldwide and Egypt. Unfortunately, percent losses of grains quantity may reach to 15-30%, as a result of stored product insect damage, and the losses increased dramatically in the last years, as an outcome of quickly productions of these pests. Experiments were conducted on infrared thermal imaging that demonstrate early detection of infestation by stored product insects in wheat, maize, broad bean, white bean and bean grains. The imaging is dependent on subtle significant differences in temperature between infested and healthy grains. Because the thermal imaging data are digital, computer programs can be used to analysis differences in temperature and mining figures explained for that. Results revealed that the use of thermal imaging offers an alternative method to detect an insect infestation. Data concluded that thermal imaging has the potential to identify whether the grains of crops that tested are infested or not, but is less effective in identifying which developmental stage is present. Moreover, it could apply this technique easily on a large scale in silos, storage, mills and granaries without negative impact on quality of stored grains.
Keywords: thermal camera; pulses; grains; insects.
INTRODUCTION
Over the years, insect damage to stored grains, pulses and cereals products has been of great concern. Quantitative and qualitative post harvest losses of stored grains in stores, silos, and granaries ranged from 10-40% of overall production (Manandhar et al., 2018). Percentage losses had increased dramatically in the last years, because most storage insects are able to increase in numbers drastically within a relatively short time (Abbas et al., 2014). The sampling and sieving method is commonly used in stored grains due to its simplicity. However, it is not appropriate for early detection of hidden infestation. This method cannot be automated, is not sustainable and imply destructive sampling (Mankin et al., 2011). Based on these disadvantages, research efforts have been directed towards detection of internal insect infestation of grains. Scientists have tested possibilities in flotation, radiographic techniques, acoustic techniques, uric acid measurement, ninhydrin-impregnated paper, nuclear magnetic resonance, and immunoassays (Pedersen, 1992).
Nowadays, thermal imaging technique that have the potential for automation of insect monitoring hence gives it amajor advantage over other methods.
As a result, enhancing application of innovate techniques to early detection of infestation became urgent need. Using thermal imaging may provide positive indicators about early detection of infestation of grain insects (Manickavasagan et al., 2008; Elhamahmy et al., 2016). These indicators help to put a plan to protect and manage stored grain from insect pests.
The aim of this study was to evaluate the infrared thermal imaging as an innovative approach for early detection on infestation of stored product insects in certain stored grains.
MATERIAL AND METHODS
Grain samples
Samples of uninfested and infested grains, pulses and cereals were obtained from mills and granaries of Eltal Elkbeer region as a specimens and sweeping and transferred to research insect’s laboratory of Plant Protection Department (Suez Canal University, Ismailia, Egypt). Specimens were divided to uninfested and infested by visual inspection and placed in glass jars 1 litre capacity. Thereafter, they preserved in incubation at 28ºC and 65% R.H to establish new generations of stored product insects.
Thermal imaging camera
Before using thermal imaging camera, the background temperature of images has been adjusted to 32ºC. Thermal images of uninfested and infested grains, cereals and pulses inside glass jar 1 litre capacity, or placed on white paper were taken with infrared thermal imaged camera (Fluke Ti32, Thermography, Germany), equipped with a 320 × 240 pixels microbolometer sensor. Sensitive in the electromagnetic spectrum ranged from 7.5-13 µm wavelengths with calibration of -10.0°C to 600.0°C and 9Hz image speed.
Measurements
Software converts temperatures to images based on colors of electromagnetic spectrum. Five temperature features (average, maximum and minimum temperatures of uninfested and infested grains, temperature range difference between maximum and minimum temperatures (At), and standard deviation were extracted from each thermal image (Wilkox and Makowski, 2014; Mahmoud and Mahfouz, 2015).
RESULTS
Detectors sensitive of Fluke camera in the 7.5-13 µm wavelength, therefore it could convert the low, mid and far infrared light into a temperature reading (Fig. 1). Infrared thermal images of wheat cereals do not involve the red color region because the glass jars prevent emit them. Fig. 2 show that heat generated from infested wheat was higher than uninfested wheat at about 70 pixels. Table 1 demonstrate results of heat generated from uninfested wheat via main images markers, as the temperature differences between uninfested and infested wheat (At=0.41).
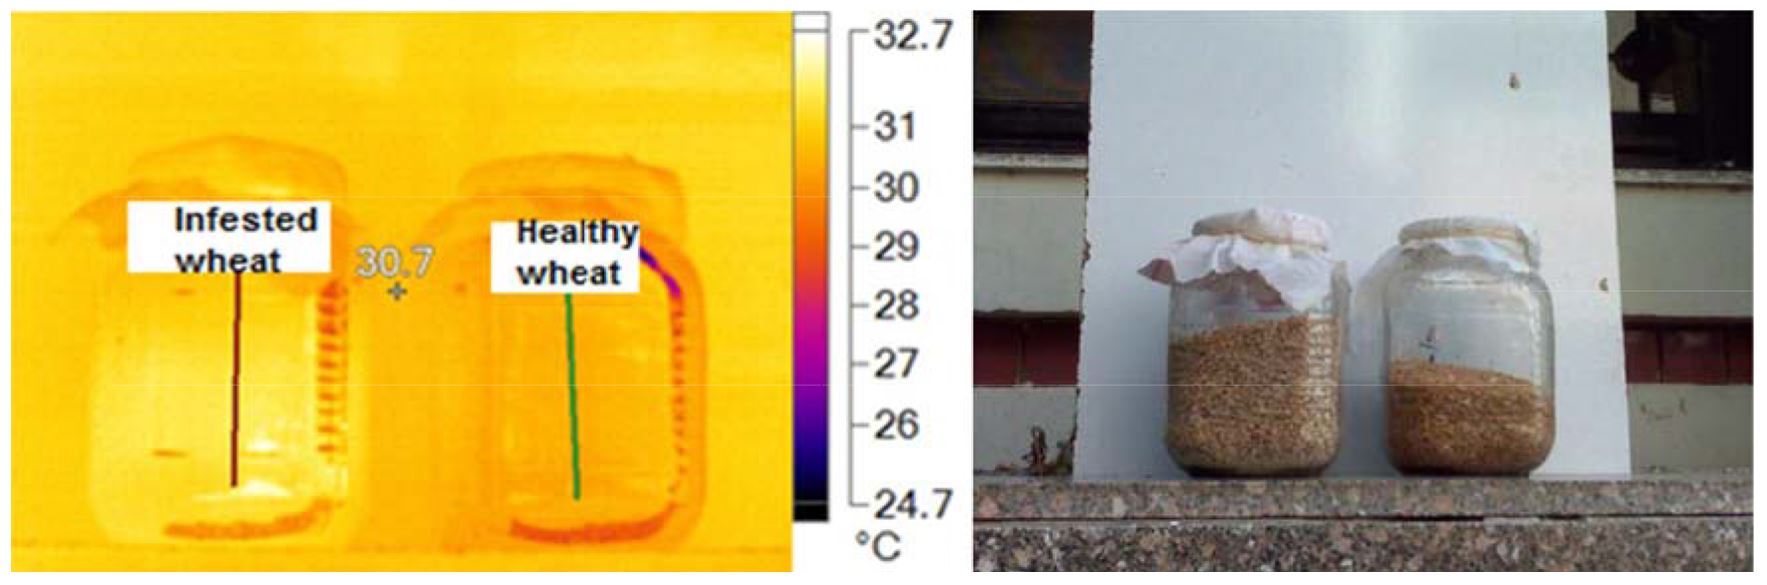
Figure 1 – Visual and infrared thermal images of wheat kernels
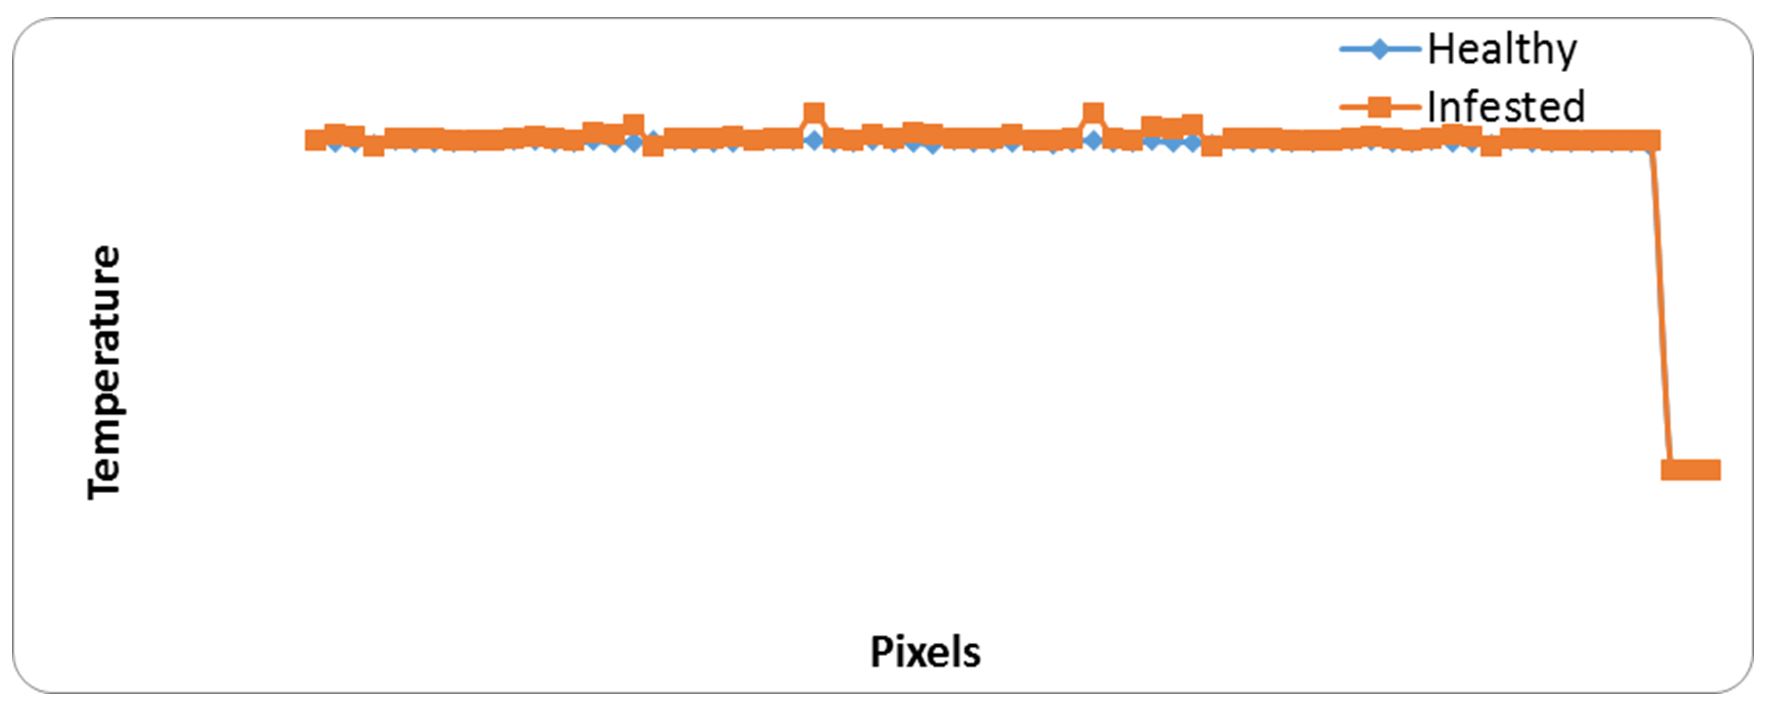
Figure 2 – Relationship between heat generated from samples of healthy and infested grains and pixel points
Table 1
Main image markers of wheat kernels
| Samples | Max.ºC | Min.ºC | Average ± SD | At |
| Healthy | 30.1 | 29.6 | 29.90±0.11 | 0.41 |
| Infested | 32.6 | 30.0 | 30.31±0.53 |
Fig. 3 shows the visual and infrared thermal imaging of broad beans with the temperature range of radiation that emitted from healthy and infested specimens. It was observed that the infested broad beans were more heat and radiation generated than the healthy broad beans (Fig. 4). Table 2 shows the main markers which recorded from thermal images as maximum temperature was 33.0 and 34.0ºC, the minimum temperature was 28.8 and 29.0ºC, average ± SD was 29.34 ±0.78 and 30.64 ±0.93 for healthy and infested specimens of broad beans, respectively. The differences between temperature at about 70 pixels of healthy and infested specimens were (At=1.30).
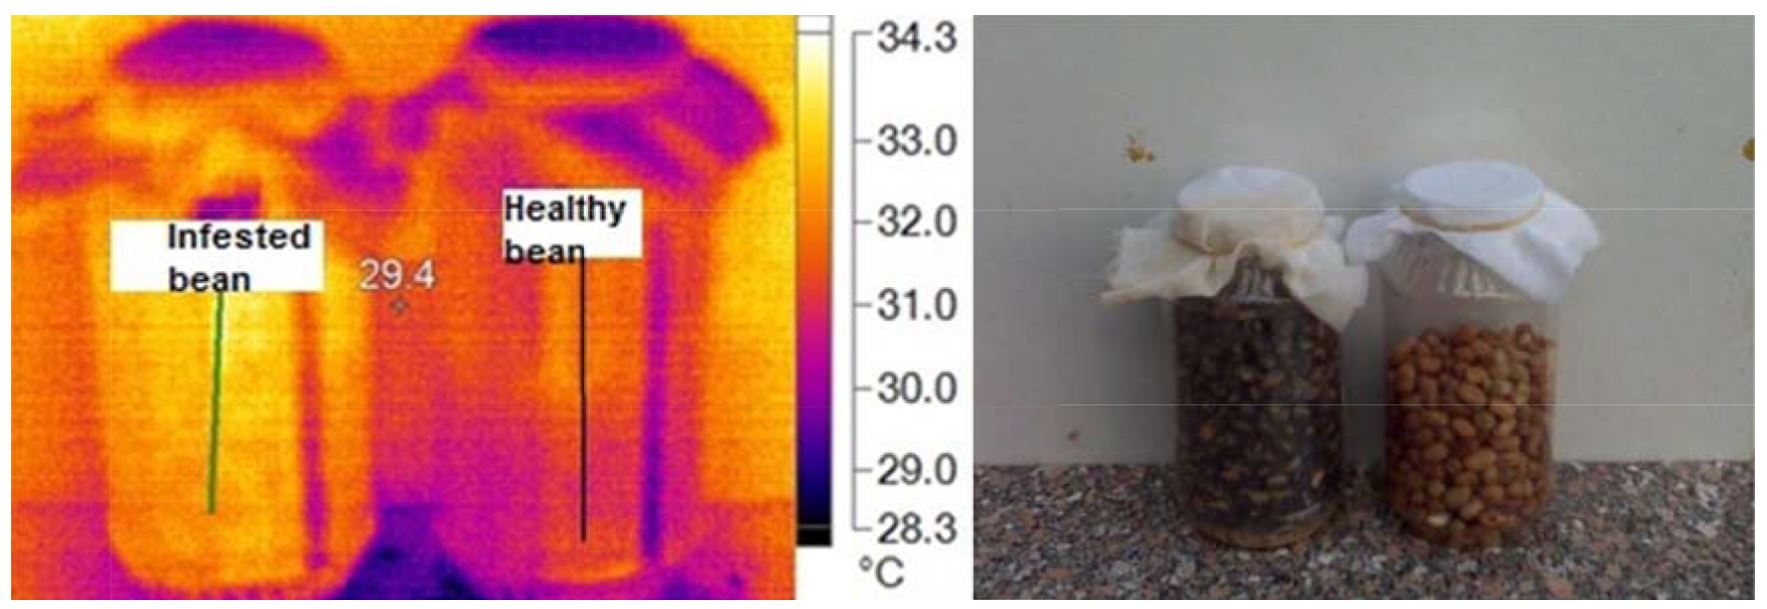
Figure 3 – Visual and infrared thermal images of broad beans
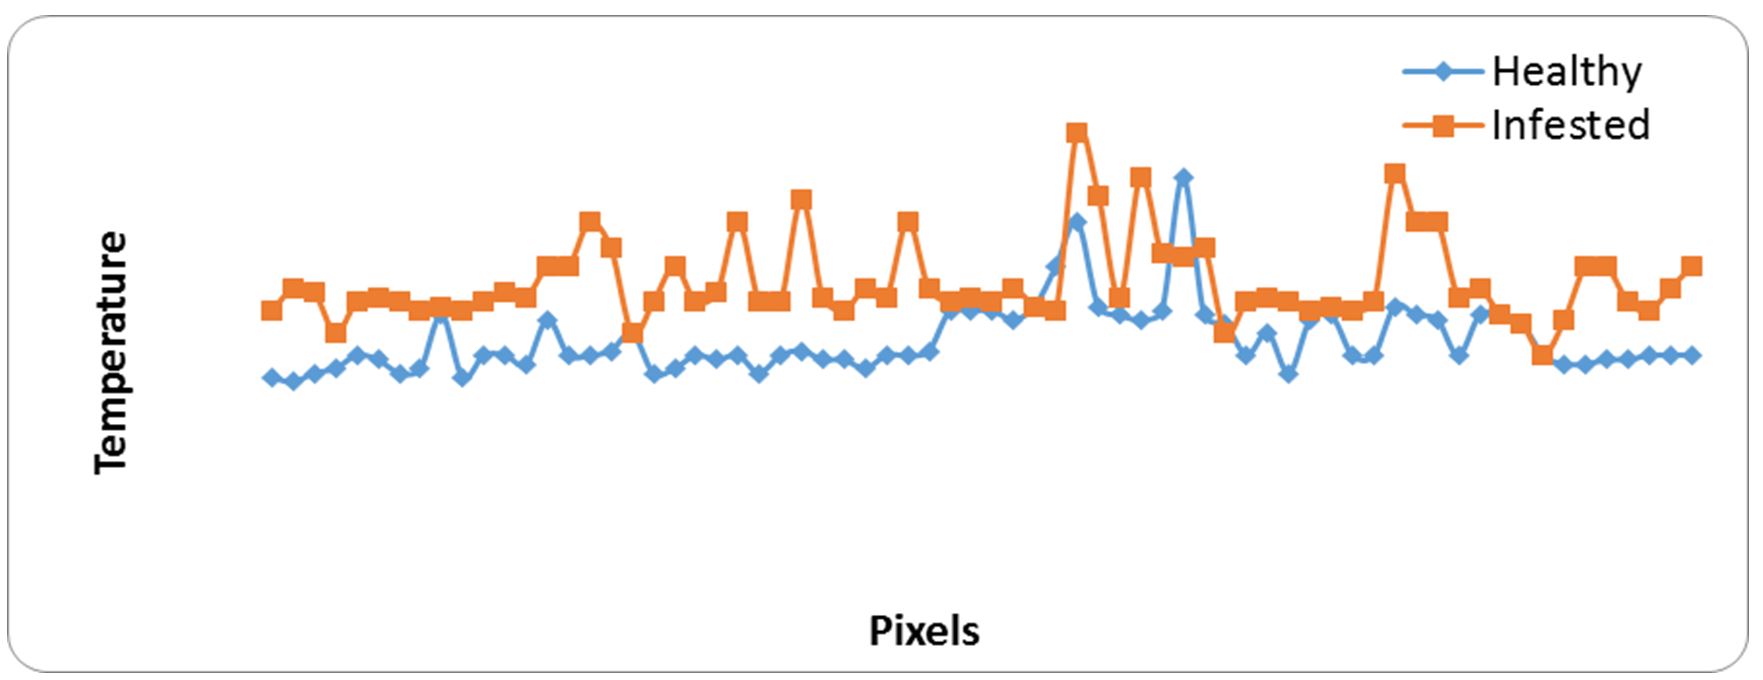
Figure 4 – Relationship between heat generated from samples of healthy and infested grains and pixel points
Table 2
Main image markers of broad bean samples
|
Samples |
Max.ºC |
Min.ºC |
Average ±SD |
At |
|
Healthy |
33.0 |
28.8 |
29.34±0.78 |
1.30 |
|
Infested |
34.0 |
29.0 |
30.64±0.93 |
Data presented in Fig. 5 and Fig. 6 clearly indicated that infested maize specimen with stored product insects hotter than uninfested maize. Breathing insects in infested specimen led to raise the rate of temperature about 0.9ºC, as a result of gas composition, relative humidity, endotoxins of fungal diseases and heat. Results in Table 3 shows the maximum, minimum and average temperature between healthy and infested maize specimen as 33.0, 34.0ºC and 28.4. 29.4ºC and 29.10±0.38, 30.06±0.56 for healthy and infested maize, respectively.
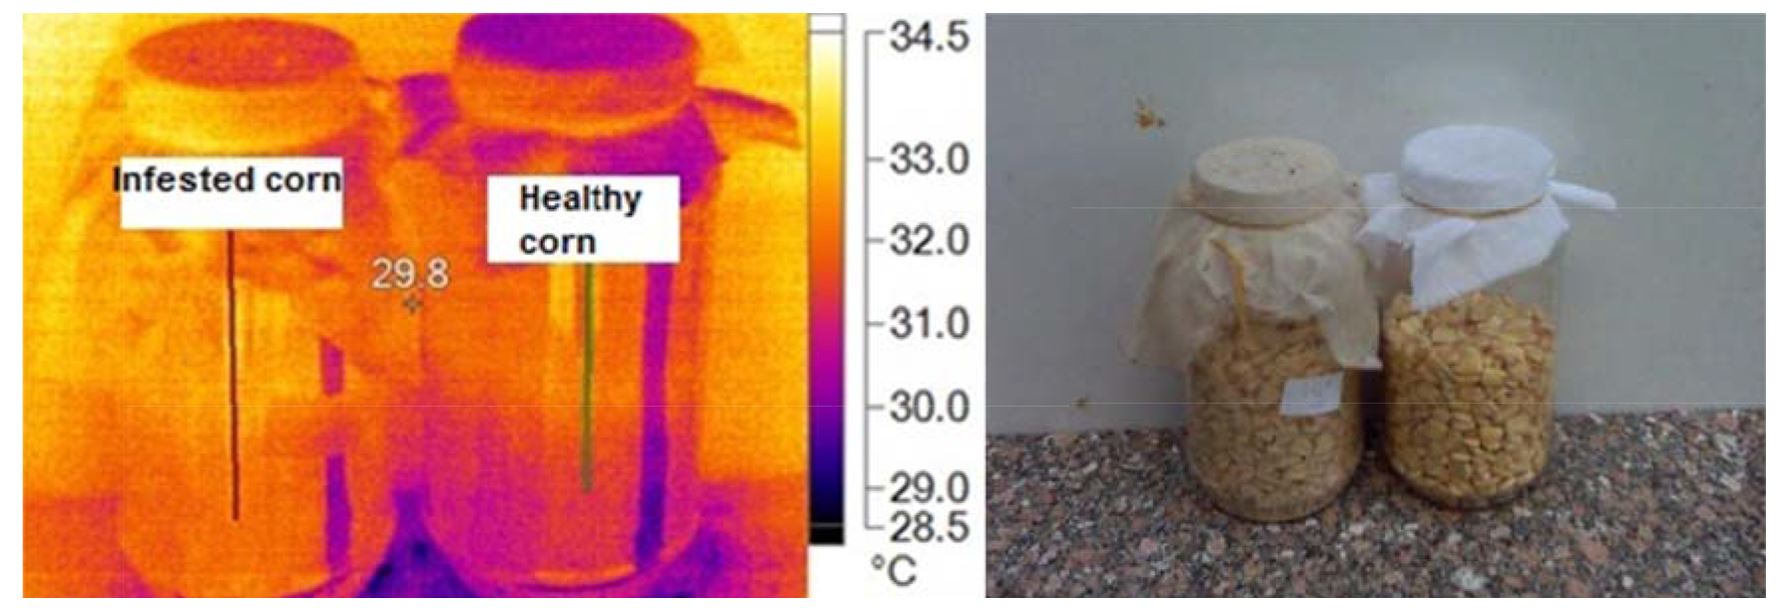
Figure 5 – Visual and infrared thermal images of maize

Figure 6 – Relationship between heat generated from samples of healthy and infested maize and pixel points
Table 3
Main image markers of maize samples
|
Samples |
Max.ºC |
Min.ºC |
Average ±SD |
At |
|
Healthy |
33.0 |
28.4 |
29.10±0.38 |
0.96 |
|
Infested |
34.0 |
29.4 |
30.06±0.56 |
Both of Fig. 7 and Fig. 8 indicated that infested specimens of white bean were hotter than un-infested ones at all pixel points. Fig. 8 clearly shows the four hot spots of infested specimens with stored product insects: this means that there is numbers of insects, and their stages inside hot spots.
Data in Table 4 clearly indicate that the main mage markers of white bean sample. The maximum temperature was 30.1ºC for healthy and 32.6ºC for infested samples. The minimum temperature was 28.11ºC for healthy and 32.6ºC for infested samples. Average temperature ± SD was 29.52±0.53ºC for healthy and 30.19±0.54ºC for infested samples, while At was 0.67ºC.
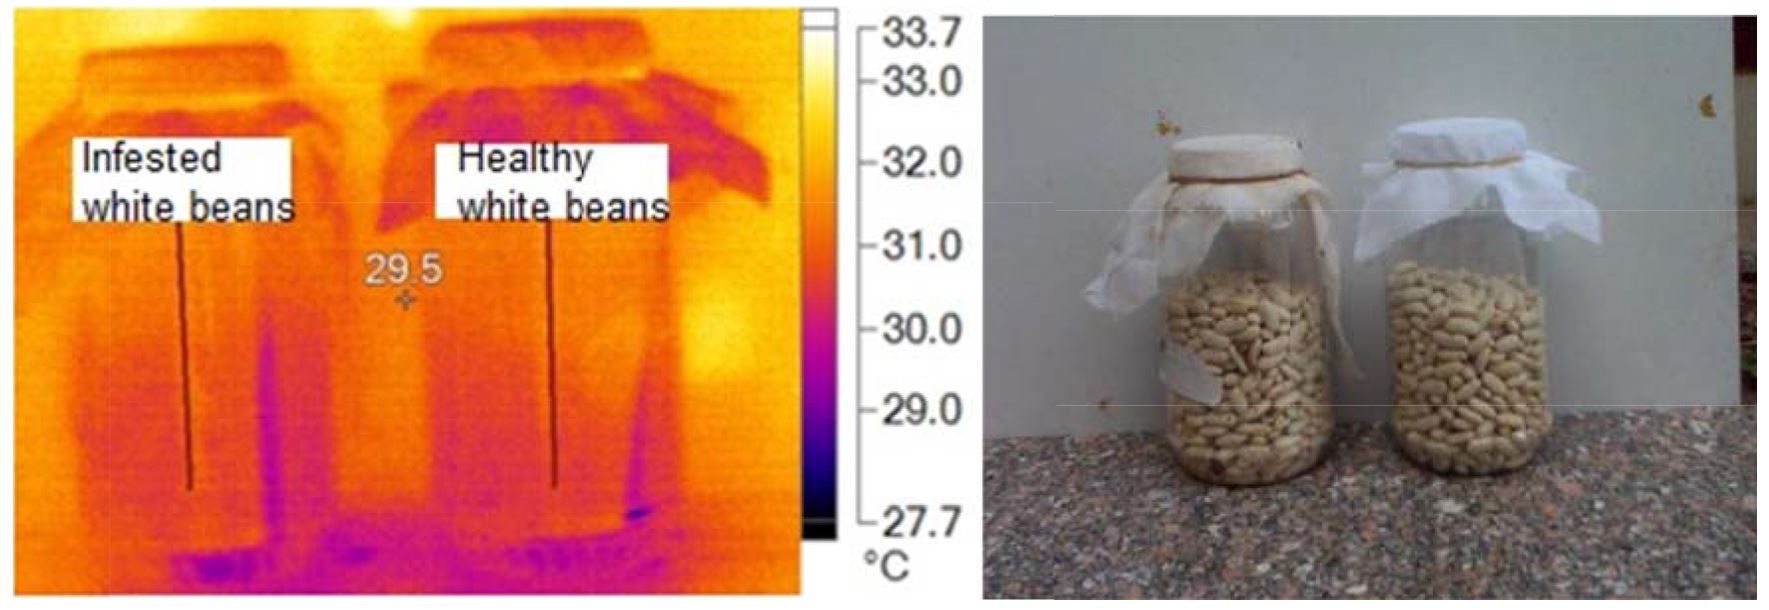
Figure 7 – Visual and infrared thermal images of white beans
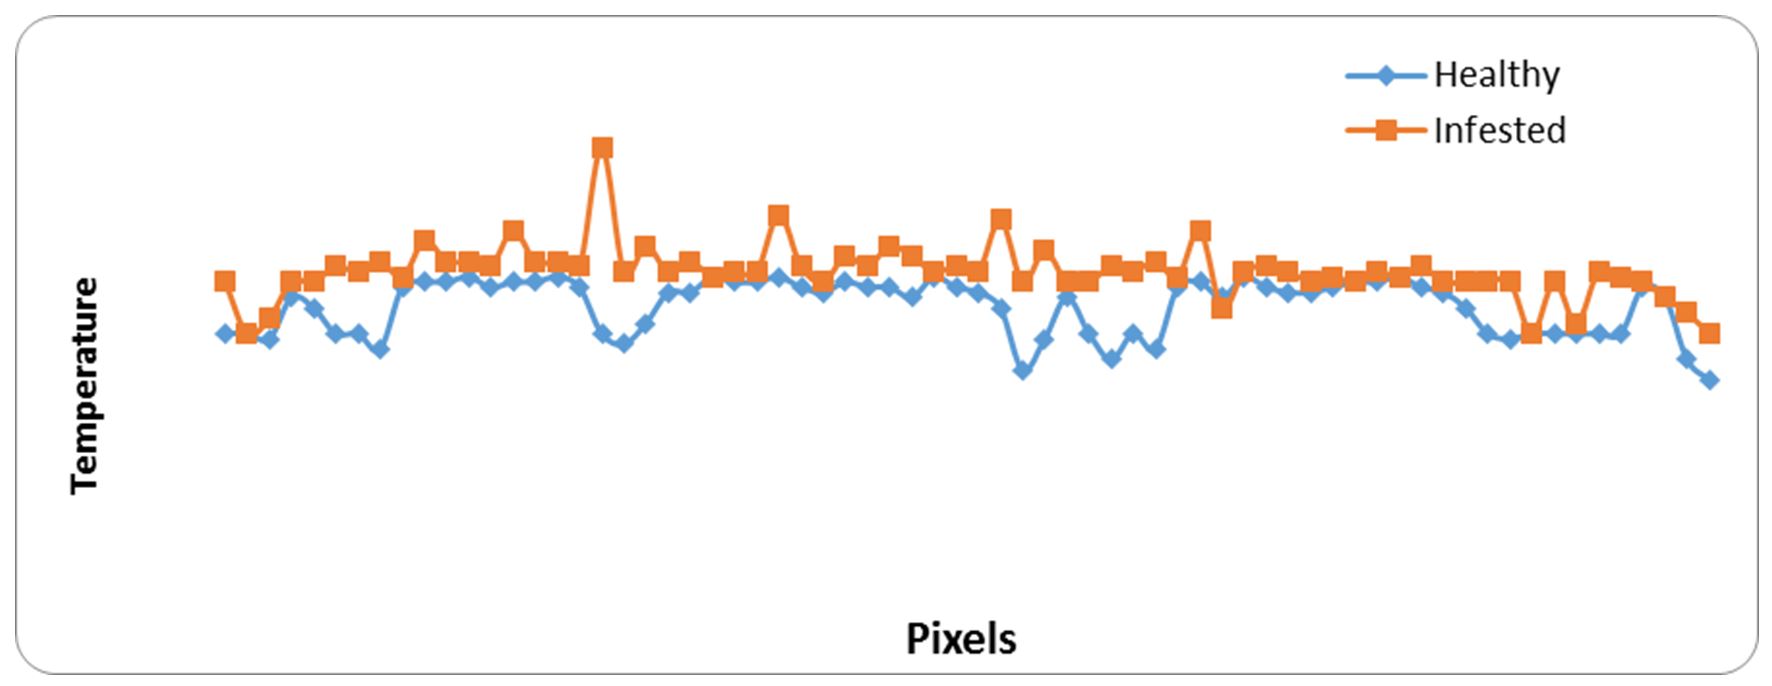
Figure 8 – Relationship between heat generated from samples of healthy and infested grains of white beans and pixel points
Table 4
Main image markers of white bean samples
|
Samples |
Max.ºC |
Min.ºC |
Average±SD |
At |
|
Healthy |
30.1 |
28.1 |
29.52±0.53 |
0.67 |
|
Infested |
32.6 |
29.0 |
30.19±0.54 |
Data obtained from Fig. 9 demonstrate that the visual and infrared images of infested wheat grains with Sitophilus oryzae. Fig. 10 explain the temperature column on the thermal images as rise in temperature of infested specimens at all pixel points. This rise is linked to number of S. oryzae and their stages. The variance between temperature of infested and uninfested samples means that (At) was high by value of 1.41, as shown in Table 5.
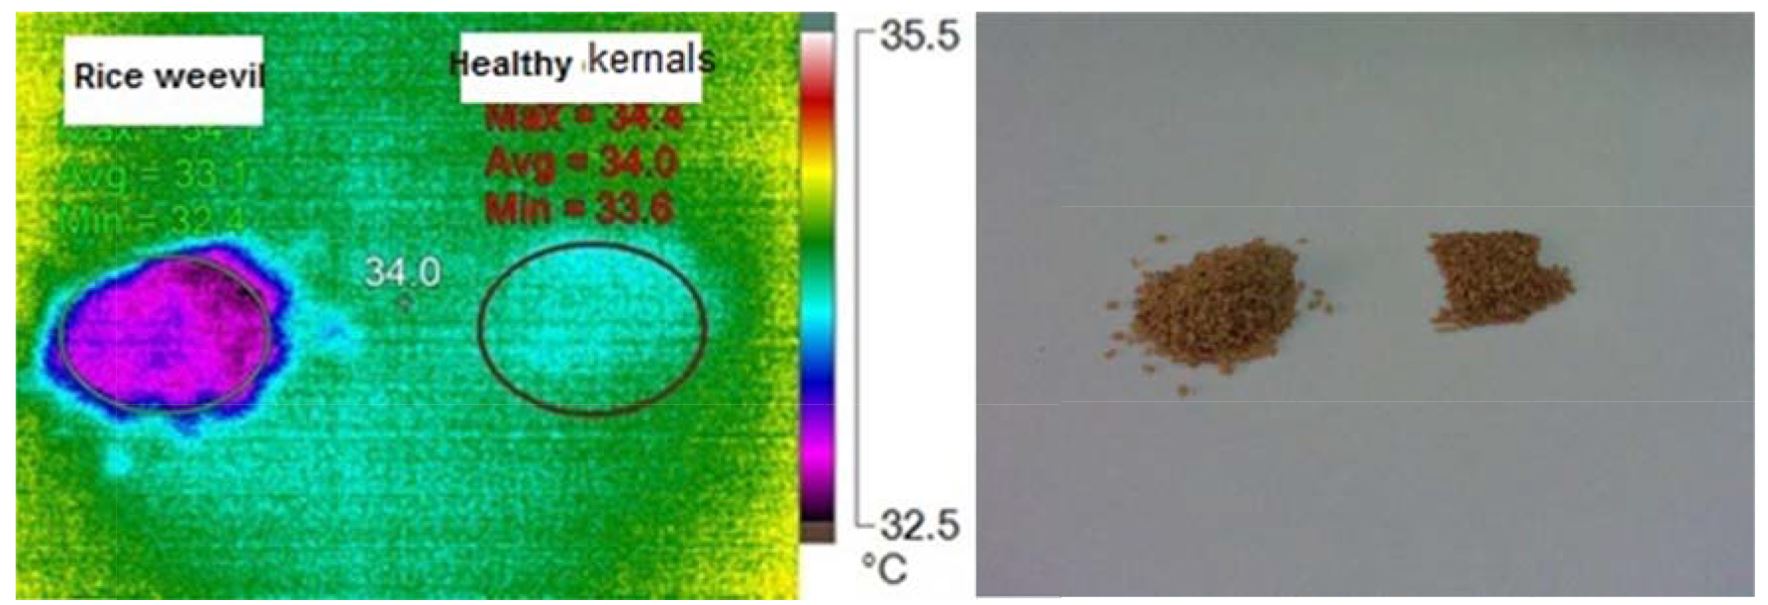
Figure 9 – Visual and infrared thermal images of wheat kernels infested with rice weevil, Sitophilus oryzae
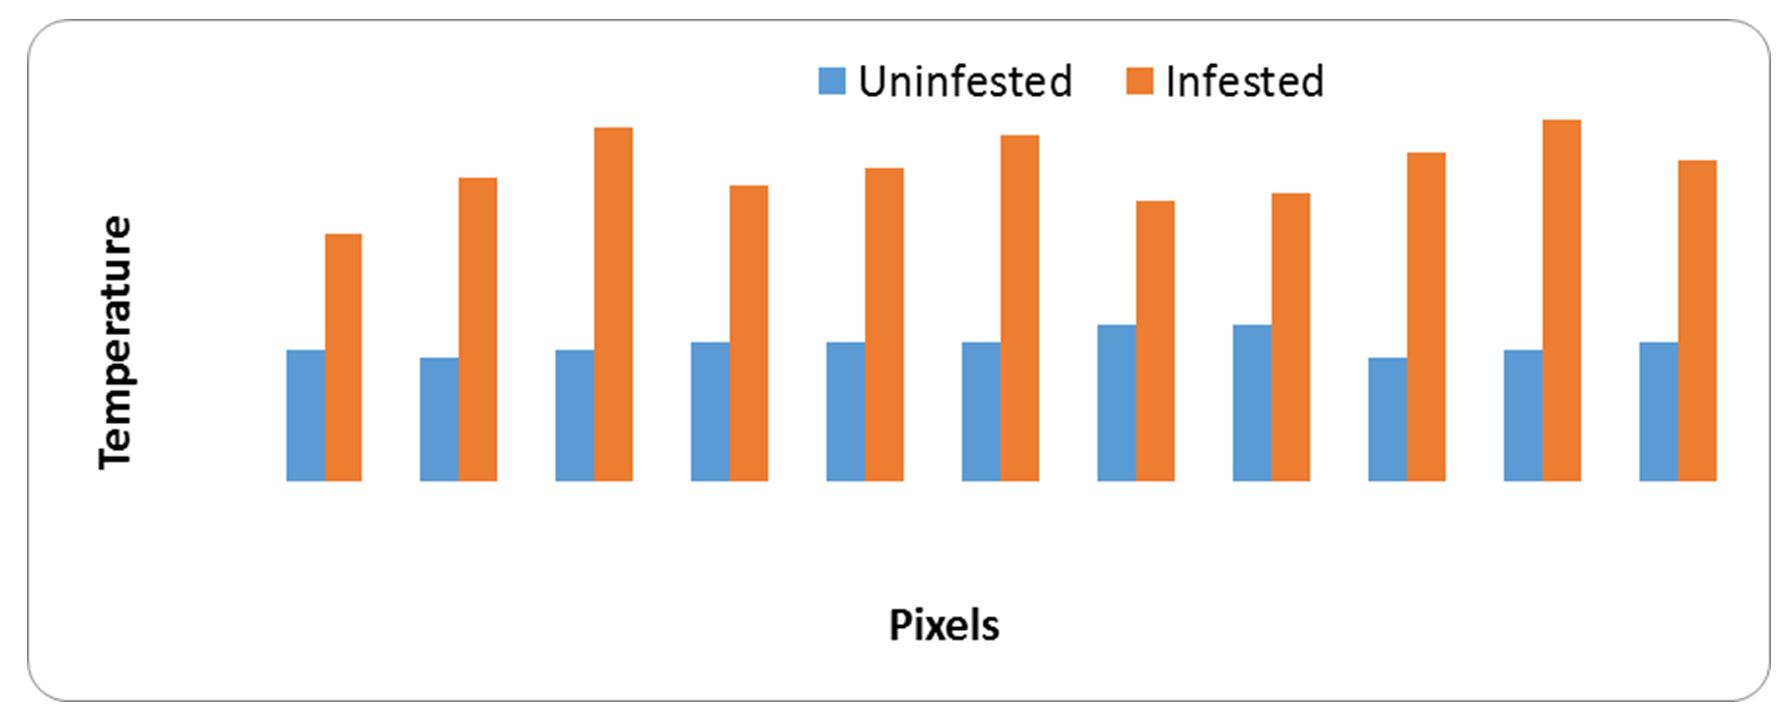
Figure 10 – Relationship between heat generated from samples of uninfested and infested grains with rice weevil, Sitophilus oryzae and pixel points
Table 5
Main image markers of wheat kernels samples
|
Samples |
Max.ºC |
Min.ºC |
Average±SD |
At |
|
Uninfested |
32.9 |
32.5 |
32.67±0.13 |
1.41 |
|
Infested |
35.4 |
34.0 |
34.08±0.41 |
Data obtained from Fig. 11 and Fig. 12 demonstrate that the raised temperature of infested specimens with Bruchidius incarnatus and their stages than uninfested samples at most pixel points. The raised temperature is a major source of stored insect (B. incarnatus). The hot spots results from insect stages and the release of carbon dioxide from breathing operation. Results obtained from Table 6 shows the main images markers of broad bean samples. The maximum temperature was 32.8ºC for healthy and 34.7 ºC for infested samples. The minimum temperature was 32.0ºC for healthy and 32.2ºC for infested samples. Also, At was 0.67ºC.
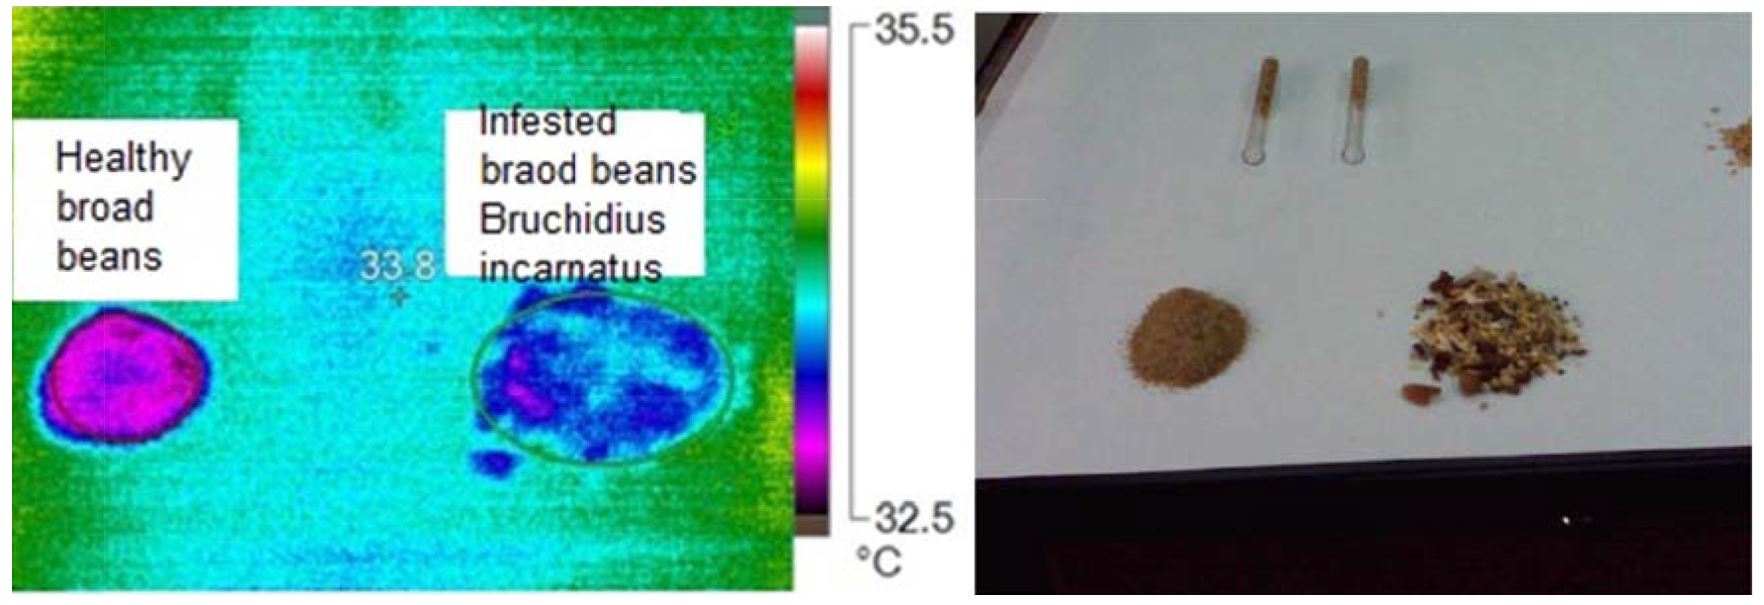
Figure 11 – Visual and infrared thermal images of broad beans infested with small faba bean beetle, Bruchidius incarnatus
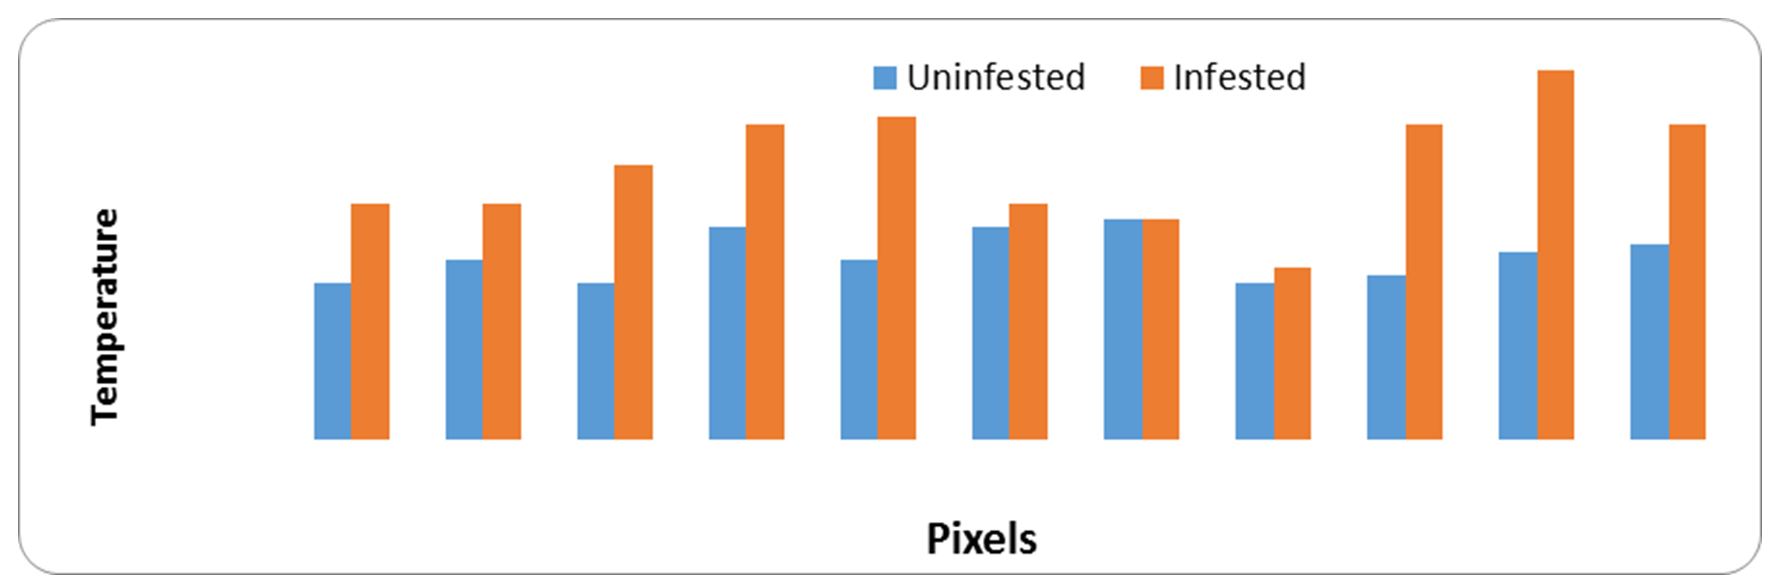
Figure 12 – Relationship between heat generated from samples of uninfested and infested broad beans with small faba bean beetle, Bruchidius incarnatus and pixel points
Table 6
Main image markers of broad beans samples
|
Samples |
Max.ºC |
Min.ºC |
Average±SD |
At |
|
Uninfested |
32.8 |
32.0 |
32.34±0.30 |
1.14 |
|
Infested |
34.7 |
32.2 |
33.48±0.74 |
The bean weevil, Acanthoscelides obtectus was identified in Plant Protection Research Institute, Department of Stored Product Insects, Cairo. Data from Fig. 13 and Fig. 14 shows the visual and infrared images, relationships between heat generated from infested and uninfested samples. Presence of bean weevil inside infested samples led to increase temperature and formation hot spots. Table 7 shows the main image markers of white bean samples
The maximum temperature was 33.2ºC for healthy and 34.2ºC for infested samples. The minimum temperature was 32.9ºC for healthy and 33.0ºC for infested samples. Also, At was 0.73ºC.
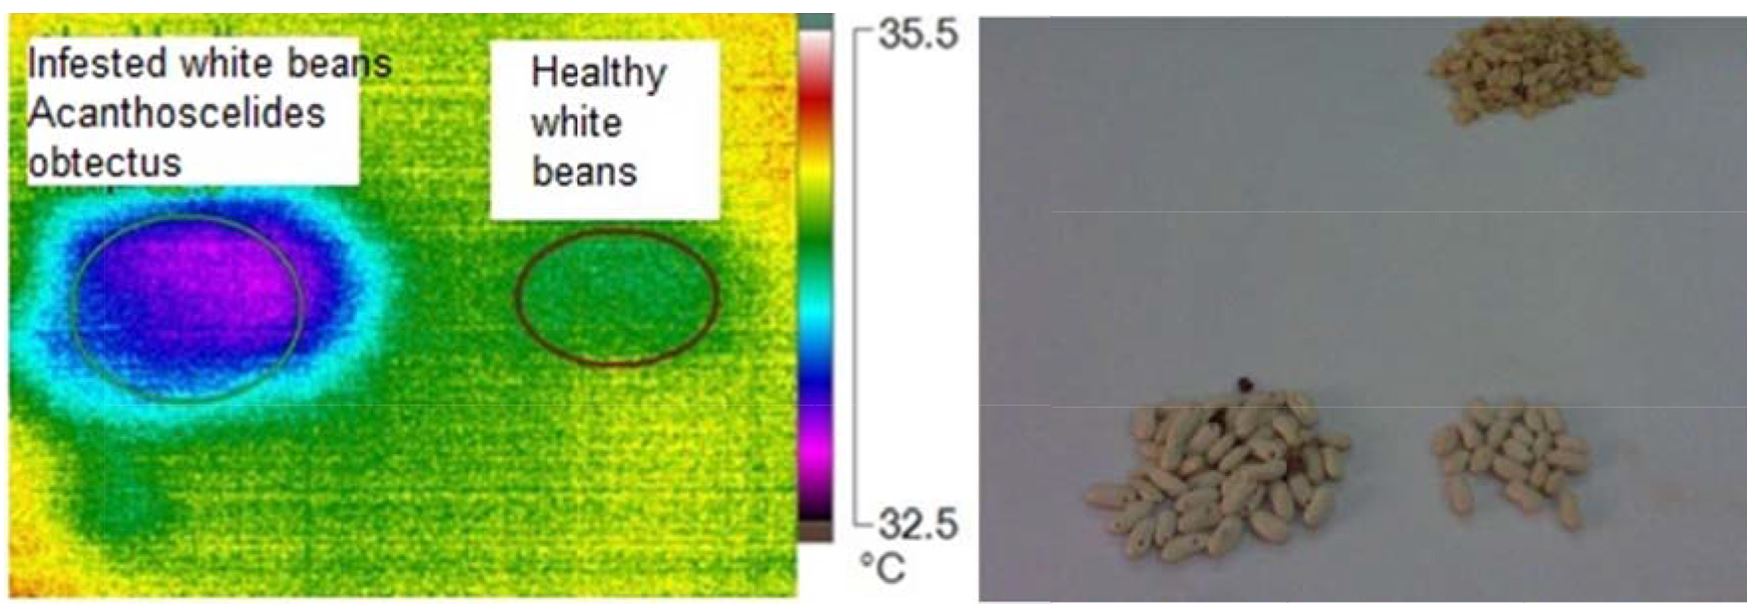
Figure 13 – Visual and infrared thermal images of white beans infested with bean weevil, Acanthoscelides obtectus

Figure 14 – Relationship between heat generated from samples of uninfested and infested white beans with bean weevil, Acanthoscelides obtectus and pixel points
Table 7
Main image markers of white beans samples
|
Samples |
Max.º C |
Min.º C |
Average±SD |
At |
|
Uninfested |
33.2 |
32.9 |
33.05±0.12 |
0.73 |
|
Infested |
34.2 |
33.0 |
33.78±0.33 |
DISCUSSION
The use of thermal imaging offers an alternative method to detect an insect infestation. Because, the respiration of insects results heat production, higher than that of the grain (Emekci et al., 2002, 2004). The presence of insects also raises the product temperature, due to their feeding activity, resulting in “hot spots” (Mills, 1989). These spots in turn lead to concentrating of humidity within the product, thus stimulating seed deterioration and further fungal activity.
Manickavasagan et al. (2008) used an infrared thermal imaging system to detect infestation by Cryptolestes ferrugineus inside wheat kernels. This system was developed to detect infestation by six developmental stages (four larval instars, pupae and adults) of C. ferrugineus under the seed coat on the germ of the wheat kernels. The highest temperature values on the surface of the grain were significantly higher (α=0.05) for grains having young larvae inside than grains having pupae inside. Temperature distribution on the surface of the infested kernels with different stages of C. ferrugineus was highly correlated with the respiration rate of each developmental stage.
CONCLUSIONS
Despite using infrared thermal imaging in the pest detection of stored product insects is not famous, paucity of researchers and researches have hindered being it a valuable tool, but it could help to implement appropriate control practices for insect disinfestations to minimize the storage losses. Data concluded that thermal imaging has the potential to identify whether the grain is infested or not, but is less effective in identifying which developmental stage is present.
REFERENCES
Abass, A.B., Ndunguru, G., Mamiro, P., Alenkhe, B., Mlingi, N. & Bekunda, M. (2014). Post-harvest food losses in maize-based farming system of semi-arid savannah area of Tanzania. J. Stored Prod.Res., 57: 49-57, DOI: 10.1016/j.jspr.2013.12. 004
Elhamahmy, M.A.M., Mahmoud, M.F. & Bayoumi, T.Y. (2016). The effect of applying exogenous salicylic acid on aphid infestation and its influence on histo-physiological traits and thermal imaging of canola. Cercet.Agron. în Moldova, 49(2): 67-85, DOI: 10.1515/cerce-2016-0016
Emekci, M., Navarro, S., Donahaye, E., Rindner, M. & Azrieli, A. (2002). Respiration of Tribolium castaneum (Herbst) at reduced oxygen concentrations. J. Stored Prod.Res., 38 (5): 413425, DOI: 10.1016/S00 22-474X(01)00045-5
Emekci, M., Navarro, S., Donahaye, E., Rindner, M. & Azrieli, A. (2004). Respiration of Rhyzopertha dominica (F.) at reduced oxygen concentrations. J. Stored Prod.Res., 40(1): 27-38, DOI: 10.1016/S0022-474X(02)00076-0
Mahmoud, M.F. & Mahfouz, M.H. (2015). Effects of salicylic acid elicitor against aphids on wheat and detection of infestation using infrared thermal imaging technique in Ismailia, Egypt. Pestic.Phytomed., 30(2): 91-97, DOI: 10.2298/PIF150 2091M
Manandhar, A., Milindi, P. & Saha, A. (2018). An overview of the post-harvest grain storage practices of smallholder farmers in developing countries. Agriculture, 8(4): 57-83, DOI: 10.3390/agriculture8040057
Manickavasagan, A, Jayas, D.S. & White, N.D.G. (2008). Thermal imaging to detect infestation by Cryptolestes ferrugineus inside wheat kernels. J. Stored Prod.Res., 44 (2): 182-196, DOI: 10.1016/j.jspr. 2007.10.006
Mankin, R.W. & Hagstrum, D. (2011). Acoustic monitoring of insects. In: D.W. Hagstrum, T.W. Phillips and G. Cuperus (Eds.), Stored product protection, Publication S156-22. Kansas State University Press, Manhattan, pp. 263-269.
Mills, J. (1989). Spoilage and heating of stored agricultural products. Prevention, detection and control, p.101. Agric. Canada Pub.1823E.
Pedersen, J.R. (1992). Insects: identification, damage, and detection. In: Storage of Cereal Grains and Their Products, D.B. Sauer (Ed.), St. Paul, MN: AACC, 435-489.
Wilcox, J. & Makowski, D. (2014). A meta-analysis of the predicted effects of climate change on wheat yields using simulation studies. Field Crops Res., 156: 180-190, DOI: 10.1016/j.fcr.2013.11.008.
Ameen A., Ibrahim A.I., Mahmoud M.F., Saad M.I., Said Maysa, Yousry M.A.

© by the authors; licensee Journal of Applied Life Sciences and Environment, Iasi, Romania. This article is an open access article distributed under the terms and conditions of the Creative Commons Attribution License (http://creativecommons.org/licenses/by/4.0)
