Souad Ourabit, Abderrahim Ettaqy, Mohamed El Ghachi
ABSTRACT. The issue of desertification is a pressing concern for many vulnerable regions, with consequences that extend far beyond their borders. It is a silent force that not only contributes to global climate change by releasing stored carbon from vegetation and soil but also compounds the ongoing environmental challenges we face on a global scale. In Morocco, the effects of these climate changes are already noticeable, particularly in terms of water scarcity due to reduced rainfall and rising temperatures. This, in turn, leads to soil drying and an increased risk of degradation. The Oum Er-Rbia watershed (upstream of Ouled Sidi Driss) is one of the basins affected by this issue, covering an area of 11,152 km² and spanning three topographic units (the Middle Atlas Mountains, the Phosphate Plateau and the Tadla Plain). This topographic diversity causes regional variation in the sensitivity to desertification. Therefore, this study aims to evaluate the sensitivity to desertification in this watershed by using the MEDALUS model (Mediterranean desertification and land use), which calculates the Desertification Sensitivity Index (DSI) through the composition of four indices: the Soil Quality Index (SQI), the Vegetation Quality Index (VQI), the Climate Quality Index (CQI) and the Land Use Quality Index (LUQI). The results show that the critical and highly sensitive zones represent 44% and are located at the northeast and west ends of the watershed. By contrast, the unaffected zones represent 12% of the total area of the watershed and correspond to the upstream area, where the climate, vegetation and land use systems are of good quality, providing effective protection for the land. To reduce the impact of this phenomenon, we have proposed some potentially impactful development actions based on land use and the results obtained.
Keywords: climate change; desertification sensitivity; drought; MEDALUS; Oum Er-Rbia watershed.
Cite
ALSE and ACS Style
Ourabit, S.; Ettaqy, A.; El Ghachi, M. Assessment of sensitivity to desertification in the Oum Er-rbia watershed (upstream of Ouled Sidi Driss) using the MEDALUS approach. Journal of Applied Life Sciences and Environment 2024, 57 (1), 149-168.
https://doi.org/10.46909/alse-571129
AMA Style
Ourabit S, Ettaqy A, El Ghachi M. Assessment of sensitivity to desertification in the Oum Er-rbia watershed (upstream of Ouled Sidi Driss) using the MEDALUS approach. Journal of Applied Life Sciences and Environment. 2024; 57 (1): 149-168.
https://doi.org/10.46909/alse-571129
Chicago/Turabian Style
Souad Ourabit, Abderrahim Ettaqy, and Mohamed El Ghachi. 2024. “Assessment of sensitivity to desertification in the Oum Er-rbia watershed (upstream of Ouled Sidi Driss) using the MEDALUS approach” Journal of Applied Life Sciences and Environment 57, no. 1: 149-168.
https://doi.org/10.46909/alse-571129
View full article (HTML)
Assessment of Sensitivity to Desertification in the Oum Er-Rbia Watershed (Upstream of Ouled Sidi Driss) Using The Medalus Approach
Souad OURABIT1*, Abderrahim ETTAQY2 and Mohamed EL GHACHI1
1Faculty of Letters and Human Sciences, University Sultan Moulay Sliman, Béni Mellal, Morocco; elghachi_mohamed@yahoo.fr
2Laboratoire de Génie Environnemental, Écologique et Agro-industriel, Faculté des Sciences et Techniques, Université Sultan Moulay Slimane, Béni Mellal, Morocco; yqatte@gmail.com
*Correspondence: ourabit.souad.phd@usms.ac.ma
Received: Nov. 17, 2023. Revised: Jan. 26, 2024. Accepted: Feb. 16, 2024. Published online: Mar. 25, 2024
ABSTRACT. The issue of desertification is a pressing concern for many vulnerable regions, with consequences that extend far beyond their borders. It is a silent force that not only contributes to global climate change by releasing stored carbon from vegetation and soil but also compounds the ongoing environmental challenges we face on a global scale. In Morocco, the effects of these climate changes are already noticeable, particularly in terms of water scarcity due to reduced rainfall and rising temperatures. This, in turn, leads to soil drying and an increased risk of degradation. The Oum Er-Rbia watershed (upstream of Ouled Sidi Driss) is one of the basins affected by this issue, covering an area of 11,152 km² and spanning three topographic units (the Middle Atlas Mountains, the Phosphate Plateau and the Tadla Plain). This topographic diversity causes regional variation in the sensitivity to desertification. Therefore, this study aims to evaluate the sensitivity to desertification in this watershed by using the MEDALUS model (Mediterranean desertification and land use), which calculates the Desertification Sensitivity Index (DSI) through the composition of four indices: the Soil Quality Index (SQI), the Vegetation Quality Index (VQI), the Climate Quality Index (CQI) and the Land Use Quality Index (LUQI). The results show that the critical and highly sensitive zones represent 44% and are located at the northeast and west ends of the watershed. By contrast, the unaffected zones represent 12% of the total area of the watershed and correspond to the upstream area, where the climate, vegetation and land use systems are of good quality, providing effective protection for the land. To reduce the impact of this phenomenon, we have proposed some potentially impactful development actions based on land use and the results obtained.
Keywords: climate change; desertification sensitivity; drought; MEDALUS; Oum Er-Rbia watershed.
INTRODUCTION
Desertification is a phenomenon that threatens several regions in the world, with 121 million hectares at risk of desertification in the Maghreb (GTD, 2016). In Morocco, the desertification process affects an extensive area, with more than 90% of the territory being impacted, especially in arid climates and areas where the soils are vulnerable to erosion (Ghanam, 2003). Indeed, the phenomenon of desertification is closely related to the climatic conditions of the area, and with the ongoing climate changes in the world today, it significantly affects many natural resources, particularly the soil.
The impact of climate change on the environmental system is remarkably significant. It has disrupted the climate system, primarily due to the increase in greenhouse gas emissions into the atmosphere. Among the consequences of these disturbances, we find global warming, which has led to an increase in the frequency, intensity and duration of hot events. Alongside these events, evapotranspiration and a decrease in precipitation volume, interacting with climate variability and human activities, have contributed to desertification (IPCC, 2019).
In Morocco, the first manifestations of climate change are already visible as an estimated global mean warming of around 1°C throughout the territory, temporal and spatial variability of precipitation with a significant decrease ranging from 3% to 30%, depending on the regions, and an acceleration of extreme events, particularly droughts and floods (MDE, 2014).
These unfavourable climatic conditions have led humans to exert strong pressures on natural resources, including soil, water and vegetation. The degradation of the latter two has a significant influence on land productivity, making it highly susceptible to degradation, especially during hot periods, and according to Kosmas et al. (1999), desertification is the consequence of a set of important degradation processes in Mediterranean environments, particularly in semi-arid and arid regions, where water is the main factor limiting land use performance in ecosystems. Thus, desertification is recognized as a form of degradation in dry areas.
The assessment of desertification sensitivity plays a crucial role in environmental studies. For this purpose, several methods are implemented and applied to study this phenomenon, such as SAHARA (Sahelian Desertification and Land Use) (Cohn, 2016), the SLM Method (Sustainable Land Management) (Tsunekawa and Haregeweyn, 2021) and land dynamic models (Eric and Lambin, 2006). On the other hand, there are various decision support tools for these methods, including remote sensing in West Africa (Courel et al., 2000), geographic information systems (GIS) in Algeria (Benslimane et al., 2008), field studies (McCoy, 2004) and numerical modelling (Quazi et al., 2021).
MEDALUS (Mediterranean Desertification and Land Use) is also one of the most commonly employed methods for studying desertification, particularly sensitivity assessment. According to the consulted bibliography, various studies have utilized the MEDALUS approach, such as Lee et al. (2019) in Mongolia, Lahlaoi et al. (2017) in Morocco, Sepehr et al. (2007) in Iran and Abuzaid and Abdelatif (2022) in Egypt, with the aim of evaluating desertification sensitivity indices. Furthermore, this methodology has been validated in two areas: the Agri Basin (Italy) and the Alentejo region (Portugal), which were designated as target areas for desertification studies under the European Commission’s MEDALUS research project (Kosmas, 1999).
Indeed, the assessment of desertification sensitivity represents a pivotal stage in environmental studies. It facilitates the establishment of a diagnosis upon which planners can make informed decisions to implement measures aimed at combating desertification.
This study focuses on the Oum Er-Rbia watershed (upstream of Ouled Sidi Driss), which extends across three distinct topographic units: The Middle Atlas Mountains, the phosphate plateau and the Tadla plain. This topographic diversity results in variations in physical and human characteristics from one unit to another. In this area, our interest has centred on assessing desertification sensitivity using the MEDALUS (Mediterranean Desertification and Land Use) approach. This approach relies on calculating multiple indices that play a role in land degradation. Scientific studies conducted on the Oum Er-Rbia watershed are abundant; however, there is a notable gap in understanding the phenomenon of desertification in this specific region. It is precisely this gap that our research aims to fill, serving as a novelty and providing significant added value to the study area.
MATERIALS AND METHODS
Presentation of the study area
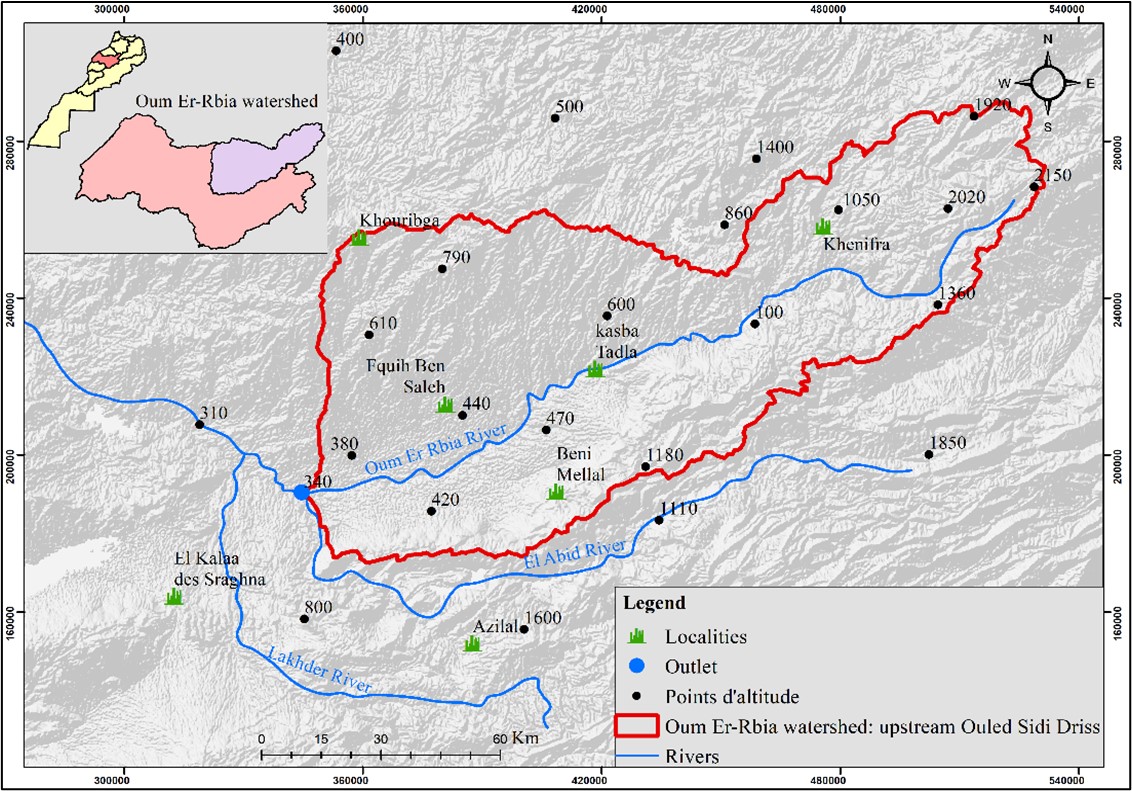
From a hydrological point of view, the Oum Er-Rbia watershed (upstream of the Ouled Sidi Driss hydrometric station) is part of the larger Oum Er-Rbia watershed (Figure 1). It covers an area of 11,152 km2 and has a perimeter of 628 km.
From an administrative point of view, this watershed covers seven provinces: Azilal, Fquih Ben Saleh, Béni Mellal, Khouribga, Khenifra and Ifrane. They are part of the Béni Mellal-Khénifra region, except for the Ifrane province, which is part of the Fès-Meknès region. It covers 100 communes, with 13 urban centres, including the main ones: Khénifra, El Ksiba, Kasba Tadla, Béni Mellal and Khouribga. The remaining 87 are rural communes, specifically Timahdit, El Borj, BniYkhlef, OuledSaid l’Oued, Guettaya, El Forka and Lagfaf.
On one hand, this watershed is characterized by the prevalence of southern slopes in the northern part of the right bank of the Oum Er-Rbia River, exposing this area to typically dry southern air currents. Conversely, the southern part, situated on the left bank, is primarily dominated by northern slopes, receiving a substantial amount of precipitation (578 mm) compared to the southern slopes where the precipitation is around 450 mm.
On the other hand, this watershed is marked by diverse land uses, including forests located in the Middle Atlas Mountains. The predominant tree species there are the evergreen oak and cedar. Moving towards the Tadla plain, there is an expansion of agricultural lands due to hydro-agricultural developments that have altered the historic landscapes of the plain (Lahlo, 2021). Furthermore, the prevalence of bare soil is notable, covering 35.16% of the total watershed area. Precipitation within the watershed is notably abundant upstream, with annual average rainfall exceeding 500 mm. Conversely, downstream, especially downstream of the Kasba Tadla station, the climate is drier, resulting in annual precipitation ranging between 450 and 300 mm (Lahlou, 2021).
The study of human characteristics has shown us that our watershed has experienced a population growth of 0.15%. This population is distributed unevenly in terms of the poverty rate, which is lower in urban centres (0.6%) and higher in mountainous municipalities (28.1%), where the main economic activity is livestock farming, accounting for over 70,000 head of livestock in these municipalities. Conversely, agricultural activity is more concentrated in the plain municipalities where the standard of living is higher.
Data
The methodology with which we will study this issue requires data related to various fields (climate, soil, vegetation and land use) because the MEDALUS method relies on a very large and comprehensive database.
Table 1 summarizes all the data used to apply the MEDALUS approach. Note that for the management quality index, the characteristics of the study area required us to add additional sub-indices to specify the results obtained in this index. The added indices are the intensity of pastureland use (IPLU), population density (PD) and poverty rate (PR).
Table 1
Set of Information Layers Used for SDI Evaluation
|
Index |
Sub index |
Unit of measurement |
Time |
Source |
|
Soil |
Parent material |
Sensitivity class |
1985 |
Geological Map of Morocco 1:1,000,000 |
|
Soil depth |
cm |
1966–1967 |
(Billaux and Bryssine, 1967; Missante, 1963) |
|
|
Texture |
Sensitivity class |
1995 |
(FAO-Unesco, 1981) |
|
|
Slope |
% |
2021 |
Digital Terrain Model (DTM) |
|
|
Drainage |
km/km² |
2021 |
Digital Terrain Model (DTM) |
|
|
Vegetation |
Erosion protection |
Sensitivity class |
24/04/2021 |
Satellite Image ‘(LANDSAT-8)’ and ‘(HCEFLCD)’ |
|
Risk of fire |
Sensitivity class |
24/04/2021 |
Satellite Image ‘(LANDSAT-8)’ and ‘(HCEFLCD)’ |
|
|
Drought resistance |
Sensitivity class |
24/04/2021 |
Satellite Image ‘(LANDSAT-8)’ and ‘(HCEFLCD)’ |
|
|
Vegetation cover |
% |
24/04/2021 |
Satellite Image ‘(LANDSAT-8)’ and ‘(HCEFLCD)’ |
|
|
Climate |
Total precipitation |
Mm |
1990-2020 |
Oum Er-Rbia Hydraulic Basin Agency |
|
Bioclimatic of EMBEGER |
Sensitivity class |
2021 |
Digital Terrain Model (DTM) |
|
|
Slope orientation |
Sensitivity class |
1990-2020 |
Oum Er-Rbia Hydraulic Basin Agency |
|
|
Management system |
Population density |
hab. /km² |
2014 |
High Commission for Planning |
|
Poverty rate |
% |
2014 |
High Commission for Planning |
|
|
Intensity of agricultural land use |
ha |
2014 |
High Commission for Planning |
|
|
Intensity of pastureland use |
Sensitivity class |
2021 |
Google earth |
Notes: FAO: Food and Agriculture Organization; UNESCO: United Nations Educational, Scientific and Cultural Organization; HCEFLCD: High Commission for Water, Forests and Combating Desertification
The first two indices were also included in this study (MOKHTARI, 2016). Regarding poverty, it plays a significant role in accelerating and worsening the degradation of natural resources, as Droy (2017) stated « It is known that land degradation, in most cases, is caused by human activities combined with environmental factors triggering negative dynamics ».
In fact, disadvantaged residents exert significant pressure on resources, particularly on water and forests, due to their lack of purchasing power to meet their essential needs. For example, they rely heavily on forest resources to obtain firewood, contributing to deforestation and reduced water availability, thus creating a vicious cycle of poverty and environmental deterioration.
Methodology
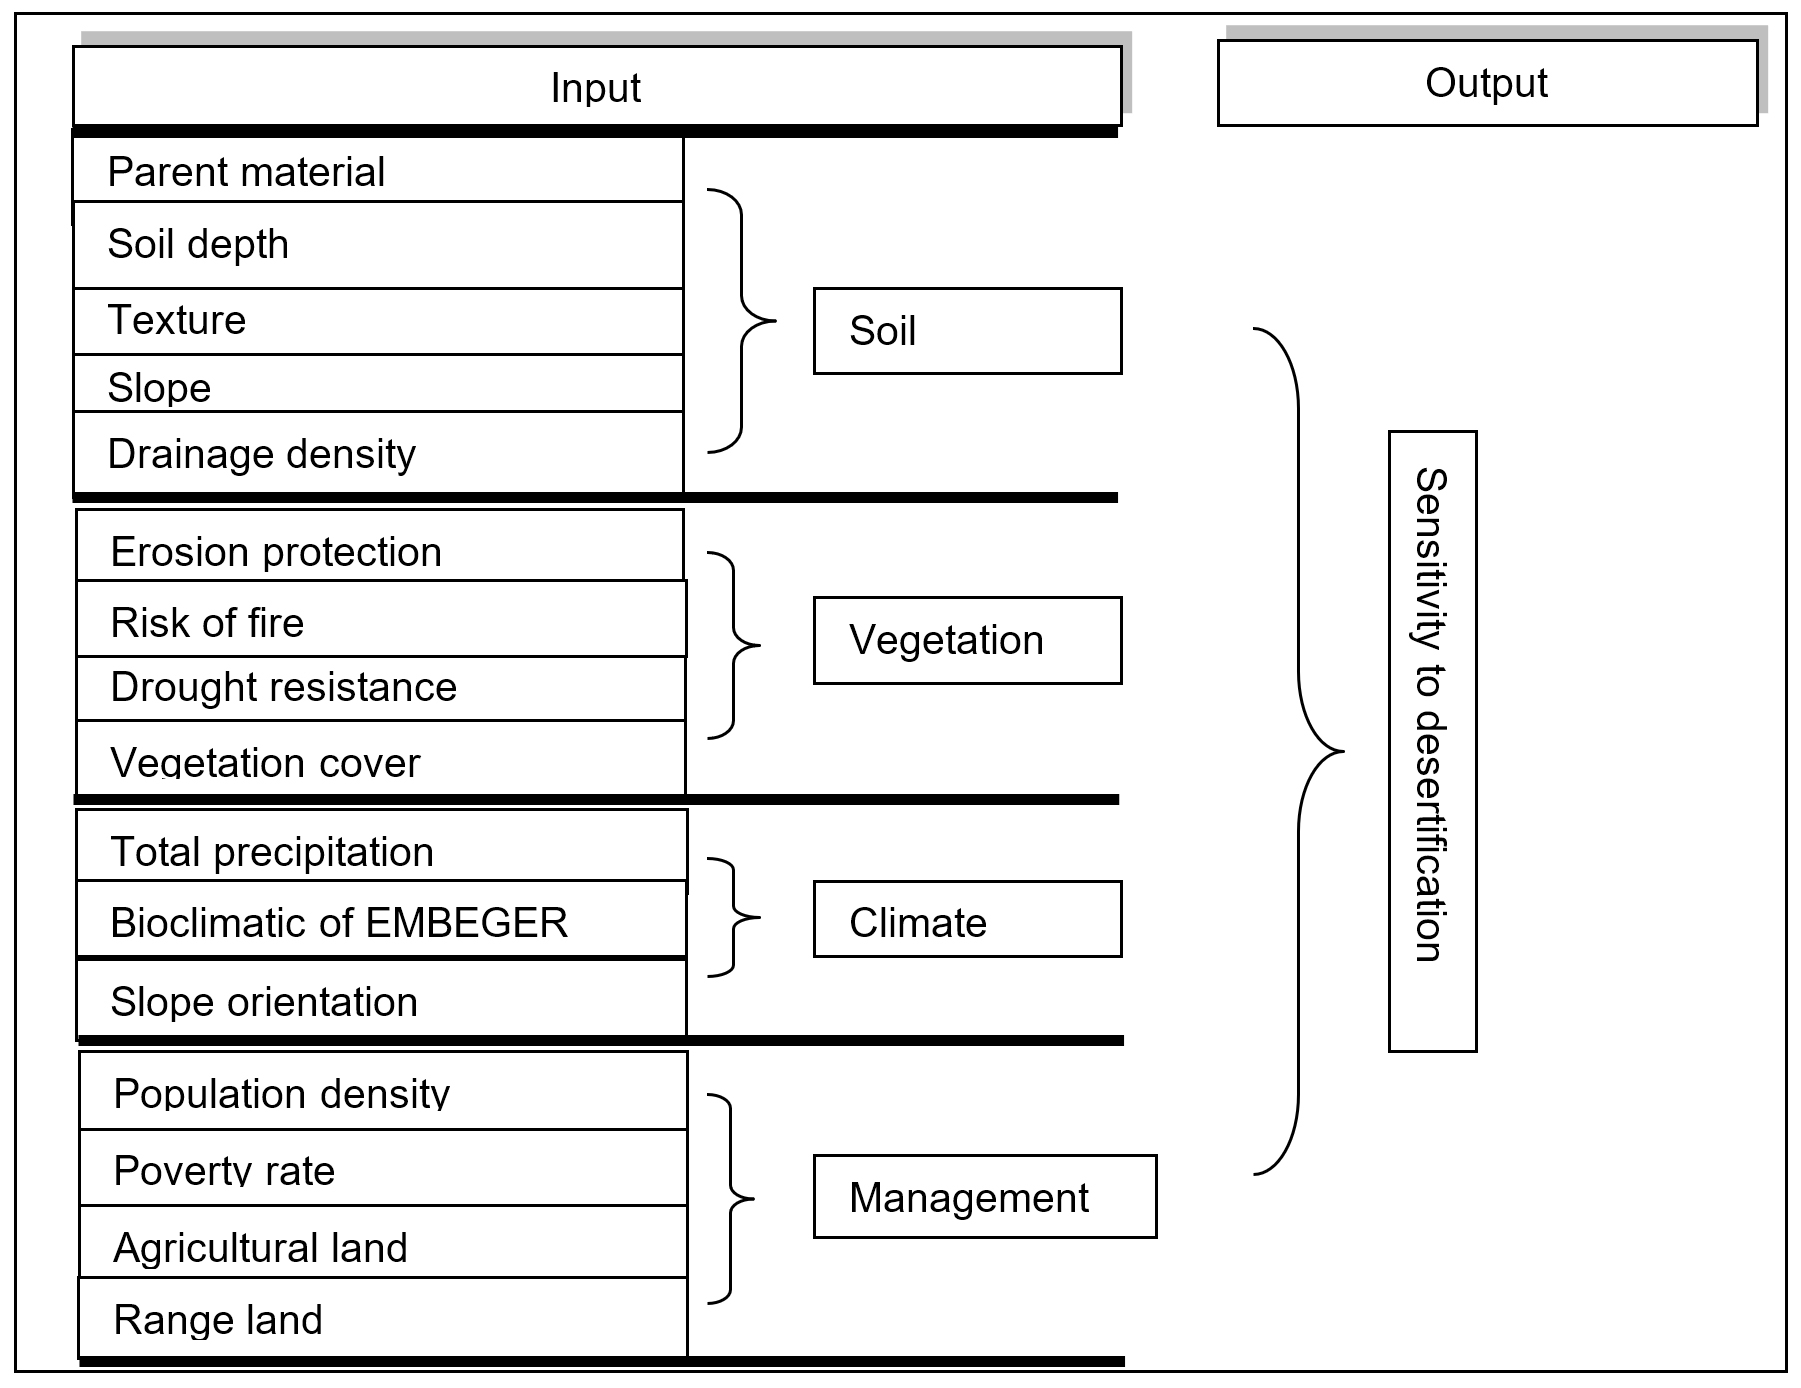
MEDALUS, Mediterranean Desertification and Land Use, is the name of a project supported by Europe aimed at evaluating, modelling and understanding the desertification phenomena that are increasingly affecting the Mediterranean region (Chandoul et al., 2014). The MEDALUS model is based on determining the desertification sensitivity index by calculating four indices as the Figure 2 shows: the soil quality index (SQI), the climate quality index (CQI), the vegetation quality index (VQI) and the land management quality index (MQI).
The calculation of each index first requires determination of the other sub-indices.
Development of the Soil Quality
Index (SQI) Map
To calculate the soil quality index (SQI), it was necessary to first determine the parent material index (PM), depth index (De), slope index (S), texture index (T) and drainage index (D).
Development of the Parent Material (PM) Map
The development of the Parent Material map was carried out based on the 1/1,000,000 geological map of Morocco, by transforming facies types into a lithological map according to their resistance to erosion (Table 2).
Development of the Depth Map (D)
Given the scarcity of soil maps in our region, the development of this index involved extracting soil units from the 1:5,000,000 global soil map of the FAO/UNESCO. Subsequently, each unit corresponds to an area in the basin, and we determined its depth based on studies conducted in the zone (refer to Table 1).
Development of the Texture Map (T)
The creation of the texture map was based on a file linked to the global soil map, which contains all the information about the texture of each soil type (Table 4).
Development of the Slope Map (S)
The creation of the slope map is based on the digital elevation model (DEM) that we transformed into a slope map using the SLOPE tool with the Geographic Information System (GIS).
Development of the Drainage Density Map (DD)
This index is also developed using the digital elevation model (DEM) used to determine the watershed’s hydrographic network. We transformed it into a drainage density map using the LINE DENSITY tool and reclassified it according to density standards (Table 6, Table 7).
Development of the Vegetation Quality Index (VQI) Map
The overlap of the vegetation fire risk index (FR), vegetation drought resistance index (DR), vegetation erosion protection index (EP) and vegetation cover index (VC) allowed us to calculate the vegetation quality index (VQI).
All the sub-indices developed for the creation of the vegetation quality map were based on two LANDSAT 8 satellite images with a spatial resolution of 30 meters and on a map of vegetation cover types.
Development of the Fire Risk (FR) Map
Is presented in Table 8.
Elaboration of the Drought Resistance Map (DR)
As described in Table 9.
Elaboration of the Vegetation-Based Erosion Protection Map (EP)
According with Table 10.
Elaboration of the Vegetation Cover Density Map (VC)
Regarding this index, and since our basin does not have a very high density, we did not mention the ‘very high’ class, which has a value of 1 (Table 11).
The VQI (Vegetation Quality Index) is obtained by combining the four indices: FR (Fire Risk), DR (Drought Resistance), ER (Erosion Protection) and VC (Vegetation Cover), according to the following equation (Equation 1):
|
VQI = (FR x DR x EP x VC) ¼ |
(1) |
Development of the Climate Quality Index (CQI) Map
The climate quality index (CQI) was obtained by overlaying the following indices: total precipitation index (TP), bioclimatic stages of EMBERGER index (BE) and slope exposure index (SE).
Development of the Total Precipitation (TP) Map
We created the precipitation map based on the average annual precipitation from a 30-year time series (1990–2020) (Table 13).
Development of the Slope Exposition (SE) Map
This index comes from the Digital Elevation Model (DEM) using the ASPECT tool in the Geographic Information System, and we classified it according to its standards (Table 14).
Development of the Bioclimatic Index Map by EMBERGER (BI)
The CQI is obtained by combining the three indices TP, SE and BI according to the following equation (Equation 2, Table 16):
|
CQI = (TP x SE x BI)1/3 |
(2) |
Development of the land management quality index (MQI) Map
Finally, the land management quality index (MQI) was based on the population density index (PD), poverty rate index (PR), intensity of pastureland use index (IPLU) and intensity of agricultural land use index (IALU).
Development of the Population Density (PD) Map
In accordance with Table 17.
Development of the Poverty Index (PI) Map
As described in Table 18.
Development of the Rangeland Land Use Map (RLUM)
Is presented in Table 19.
Development of the Agricultural Land Use Map (ALUM)
The LQI is obtained by combining the four indices PD, RLUM, ALUM and TP according to the following equation (Equation 3, Table 21):
|
IQSA = (DP x IUTA x IUTP x TP) ¼ |
(3) |
Development of the Desertification Sensitivity Index (DSI) Map
The desertification sensitivity map was developed by multiplicatively intersecting the four preceding indices using the following formula (Equation 4):
|
1/4 |
(3) |
where: DSI = Desertification sensitivity index; SQI = Soil quality index; CQI = Climate quality index; VQI = vegetation quality index; MQI = Management quality index
Based on the obtained result, we established a ranking according to ISD standards, as illustrated in Table 22.
RESULTS
Elaboration of the four sub-indices
The four sub-indices were created to develop the map of desertification sensitivity. Each index is classified according to specific standards in the approach. The soil quality index is classified within a range of 1.13 to 1.46.
For the climate quality index, the range extends from 1.15 to 1.81. The vegetation quality index is distributed within a range of 1.13 to 1.38, while the development quality index varies from 1.25 to 1.51.
Table 2
Standards for Parental Materials (PM)
|
Classes |
Description |
Value |
|
Coherent Materials |
limestone, basalt, beige limestone with flint |
1 |
|
Moderately Coherent Materials |
Marl Limestone |
1.7 |
|
Fragile Materials |
Detrital Facies, Marl, Sandstone, Silt, Black Shale |
2 |
Table 3
Standards for Soil Depth (De)
|
Classes |
Description |
Value |
|
>80 cm |
Very deep |
1 |
|
20–80 cm |
Moderately deep |
2 |
|
10–20 cm |
Shallow |
3 |
|
<10 cm |
Very shallow |
4 |
Table 4
Standards for Soil Texture (T)
|
Classes |
Description |
Value |
|
1 |
sandy-loamy, silty-sandy |
1 |
|
2 |
sandy-clayey |
1.2 |
Table 5
Standards for Slope (S)
|
Classes |
Description |
Value |
|
<6 |
Low |
1 |
|
6–18 |
Moderate |
1.2 |
|
18–35 |
High |
1.5 |
|
>35 |
Very high |
2 |
Table 6
Standard for Drainage Density (DD)
|
Classes |
Description |
Value |
|
1 |
well-drained |
1 |
|
2 |
Imperfectly drained |
1.2 |
|
3 |
poorly drained |
2 |
Table 7
Standards for Soil Quality Index (SQI)
|
Classes |
Description |
Value |
|
1 |
Good quality |
<1.13 |
|
2 |
Medium quality |
1.13–1.45 |
|
3 |
Low quality |
>1.45 |
Table 8
Standards for Vegetation Fire Risk (FR)
|
Classes |
Description |
Values |
|
Low |
Bare soil (including roads, uncultivated land) |
1 |
|
Moderate |
Agriculture, Resinous Reforestation, Deciduous Reforestation, Mixed Other Deciduous, Other Deciduous |
1.33 |
|
High |
Holm Oak, Mixed Holm Oak, Mixed Junipers, Heathland, Arborvitae, Mixed Arborvitae |
1.66 |
|
Very high |
Cedar, Mixed Cedar |
2 |
Table 9
Standards for Vegetation Drought Resistance (DR)
|
Classes |
Description |
Values |
|
Very high |
Cedar, Mixed Cedar |
1 |
|
High |
Holm Oak, Mixed Holm Oak, Mixed Junipers, Heathland, Arborvitae, Mixed Arborvitae |
1.33 |
|
Moderate |
Agriculture, Resinous Reforestation, Deciduous Reforestation, Mixed Other Deciduous, Other Deciduous |
1.66 |
|
Low |
Bare soil (including roads, uncultivated land) |
2 |
Table 10
Standards for Vegetation Erosion Protection (EP)
|
Classes |
Description |
Values |
|
Very high |
Cedar, Mixed Cedar, Arborvitae, Mixed Arborvitae |
1 |
|
High |
Cedar, Mixed Cedar, Heathland |
1.33 |
|
Moderate |
Deciduous Reforestation, Mixed Other Deciduous, Other Deciduous, Mixed Junipers |
1.66 |
|
Low |
Bare soil (including roads, uncultivated land), Agriculture |
2 |
Table 11
Standards for Vegetative Cover (VC)
|
Classes |
Description |
Values |
|
High |
Cedar, Mixed Cedar, Agriculture |
1.33 |
|
Moderate |
Arborvitae, Mixed Arborvitae, Mixed Other Deciduous, Other Deciduous, Mixed Junipers |
1.66 |
|
Low |
Bare soil (including roads, uncultivated land) |
2 |
Table 12
Standards for the Vegetation Quality Index (VQI)
|
Classes |
Description |
Values |
|
1 |
Moderate quality |
<1.13 |
|
2 |
Low quality |
1.13–1.38 |
|
3 |
Very low quality |
>1.38 |
Table 13
Standards for Total Precipitation (TP)
|
Classes |
Description |
Value |
|
1 |
<491 mm |
1 |
|
2 |
491–533 mm |
2 |
|
3 |
>533 |
3 |
Table 14
Standards for Slope Exposure (SE)
|
Classes |
Description |
Classes |
|
1 |
North, Northeast, Northwest, Flat terrain |
1 |
|
2 |
South, Southeast, Southwest |
2 |
Table 15
Standards for the Emberger Bioclimatic Index (BI)
|
Classes |
Description |
Classes |
|
1 |
Subhumid |
1.25 |
|
2 |
Semi-arid |
1.2 |
Table 16
Standards for the Climate Quality Index
|
Classes |
Description |
Value |
|
1 |
Good quality |
<1.15 |
|
2 |
Medium quality |
1.15–1.81 |
|
3 |
Low quality |
>1.81 |
Table 17
Standards for Population Density (PD)
|
Classes |
Description |
Value |
|
1 |
0–50 inhabitants/km² |
1 |
|
2 |
50–100 inhabitants/km² |
1.5 |
|
3 |
>100 inhabitants/km² |
2 |
Table 18
Standards for the Poverty Rate (PR)
|
Classes |
Description |
Value |
|
1 |
<12.3 |
1 |
|
2 |
12.3–18.6 |
1.33 |
|
3 |
18.6–27.7 |
1.66 |
|
4 |
>27.7 |
2 |
Table 19
Standards of the Intensity of Pastureland Use (IPLU)
|
Classes |
Description |
Value |
|
1 |
Low: 0–1/ha |
1 |
|
2 |
Medium: 1–2/ha |
1.5 |
|
3 |
High: >2/ha |
2 |
Table 20
Standards for Agricultural Land Intensity of Use (ALIU)
|
Classes |
Description |
Value |
|
1 |
Low: non-agricultural or extensive agriculture |
1 |
|
2 |
Medium: semi-intensive agriculture |
1.5 |
|
3 |
High: intensive agriculture |
2 |
Table 21
Standards for the Quality Index of the Planning System (AIPS)
|
Classes |
Description |
Value |
|
1 |
Good quality |
<1.25 |
|
2 |
Medium quality |
1.25–1.51 |
|
3 |
Low quality |
>1.51 |
Table 22
Desertification Sensitivity Index (SDI) Standards
|
Classes |
Desertification sensitivity |
Limit of SD classes |
|
1 |
Unaffected areas |
<1.20 |
|
2 |
Slightly sensitive areas |
1.20–1.26 |
|
3 |
Moderately sensitive areas |
1.26–1.36 |
|
4 |
Very sensitive areas |
1.36–1.46 |
|
5 |
Critical areas |
>1.46 |
Regarding the soil quality index, we noticed that soils of good quality (38%) are highly concentrated in the Tadla plain, especially in the irrigated areas of Beni Amir and Beni Moussa. On the other hand, soils of medium quality represent (45%), predominate in the basin and are distributed on the mountain slopes and the phosphate plateau.
The climate quality index shows that the upstream part of the watershed is characterized by a good-quality climate (45%), corresponding to the northern slope. There are also some regions characterized by a medium-quality climate (34%), located on the southern slope. By contrast, the downstream part is strongly dominated by a low-quality climate (21%).
As for vegetation, we observed that only the Middle Atlas Mountains are covered with medium-quality vegetation and its cover (12%), while the rest has very-poor-quality vegetation (81%). The quality of development varies from one municipality to another, and we notice that high-quality developments (63%) are concentrated upstream of the basin, while low-quality developments (12%) are located in the plain municipalities.
Desertification Sensitivity Index
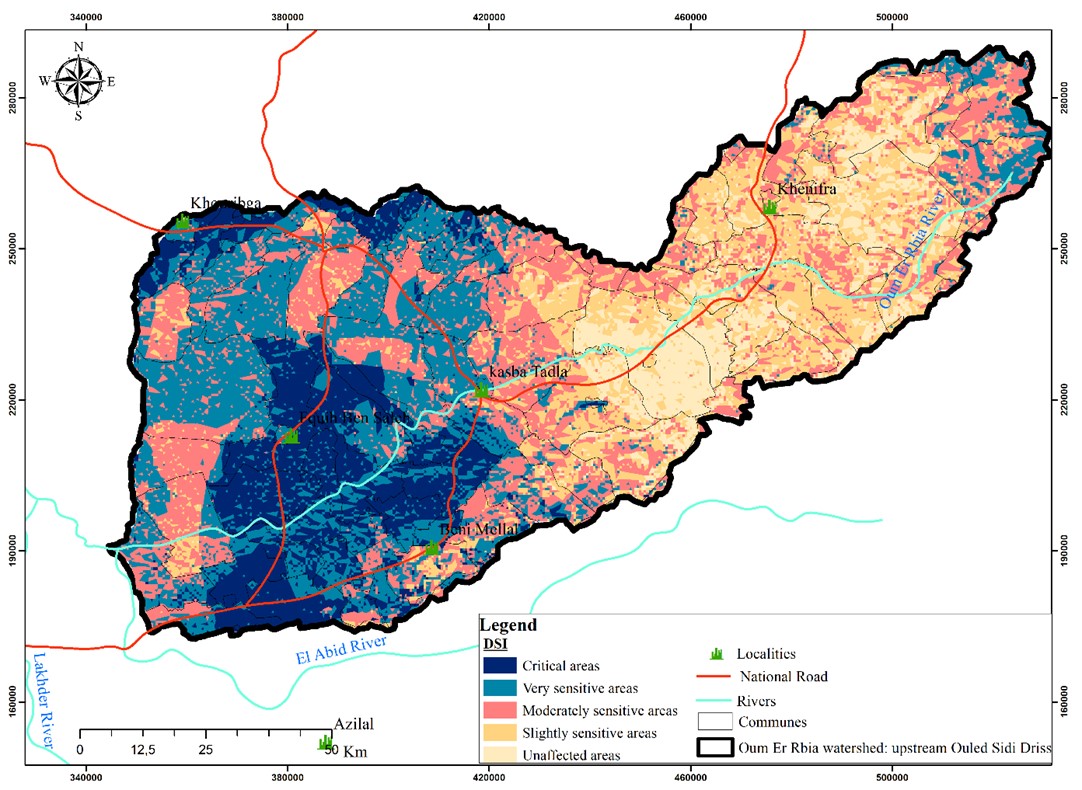
The Figure 7 shows that, the majority of the land in the 5014 km² watershed is moderately to slightly sensitive to desertification, followed by critical and highly sensitive land, covering 4505 km². The remaining 1412 km² constitutes unaffected land.
According to the desertification sensitivity map in Figure 8, we can divide the watershed into two parts:
The upstream part of the watershed is characterized by the dominance of moderately, slightly sensitive and unaffected zones. The moderately sensitive and slightly sensitive classes cover 24% and 21% of the area, respectively. The unaffected zones represent only 13%. The three classes correspond to good vegetation, climate and management quality, except for the soil, which is characterized in this part by low to moderate quality. This is due to the presence of high altitudes colonized by a green oak type vegetation cover, characterized by high drought resistance and very high erosion protection.
The downstream part of the watershed contains critical and highly sensitive areas with some moderately sensitive zones present. The highly sensitive zones represent a large proportion of the total area of the watershed, at 25%. On the other hand, the critical zones constitute 15% of the total area of the watershed.
This part is dominated by soils of good quality, but this single index is not sufficient in the face of the presence of low quality in the three indices (vegetation, climate and management), which make it very exposed to desertification sensitivity, especially in the municipalities located in the irrigated perimeters of Béni Moussa and Béni Amir, where intensive agricultural lands are present.
Zooming in on the upstream of the watershed
To effectively demonstrate the degree of sensitivity to desertification affecting our watershed from upstream to downstream, we have divided it into two parts: the upstream and the downstream. This division is based on the physical characteristics of the basin, which we found to be favourable upstream and unfavourable downstream.
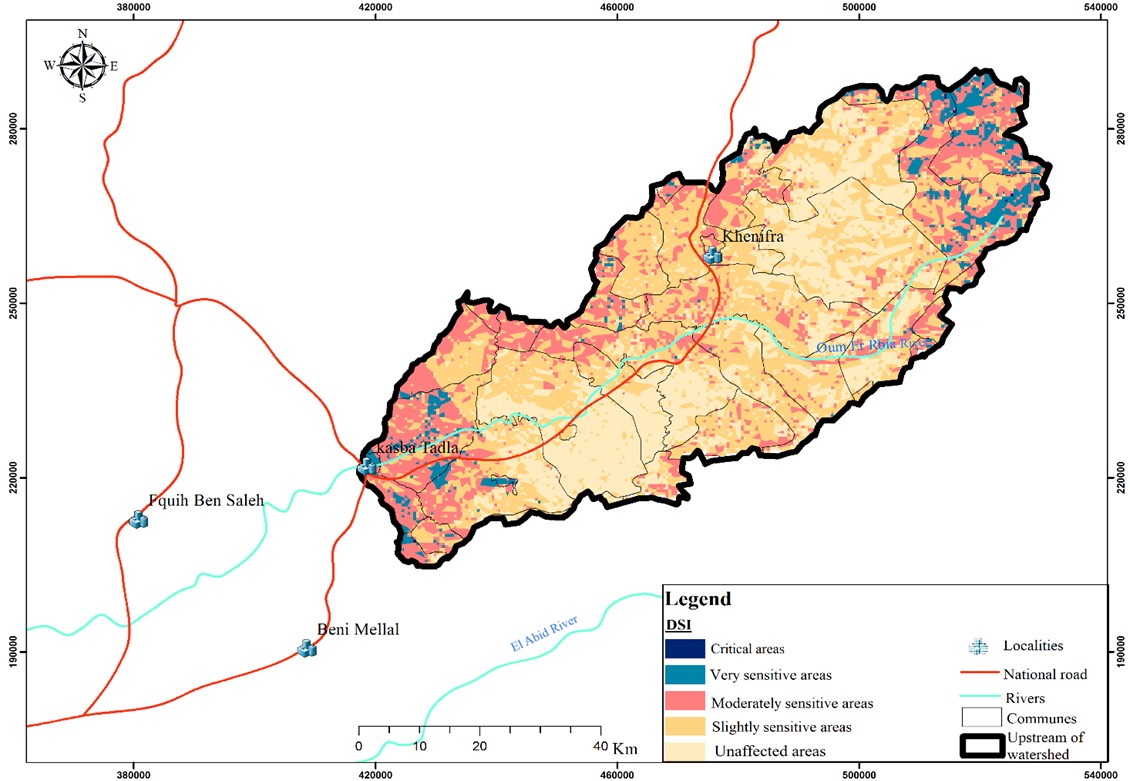
An examination of Table 23 reveals that the sensitivity to desertification is less pronounced in the upstream region. We observe that moderately to slightly sensitive areas dominate this part, covering 27% of the total watershed area, followed by unaffected zones at 12%. By contrast, highly sensitive areas account for only 2%, and critical zones represent a mere 0.017%.
We can explain the low proportions of sensitivity in this area map in Figure 9 by its favourable natural conditions that enable it to adapt to disturbances, particularly during unfavourable climate periods. Upstream of our watershed is primarily composed of high altitudes exceeding 2000 m, which allows it to be characterized by average temperatures (18.25°C) and significant rainfall (>550 mm). These conditions promote the presence of a more or less dense vegetative cover of moderate quality, which helps to protect the soil from erosion and maintain its moisture. As a result, the soil can remain more compact and carry out its biological activities.
Additionally, the low population density and the lack of agricultural lands play a role in preserving the soil in this upstream part of the watershed.
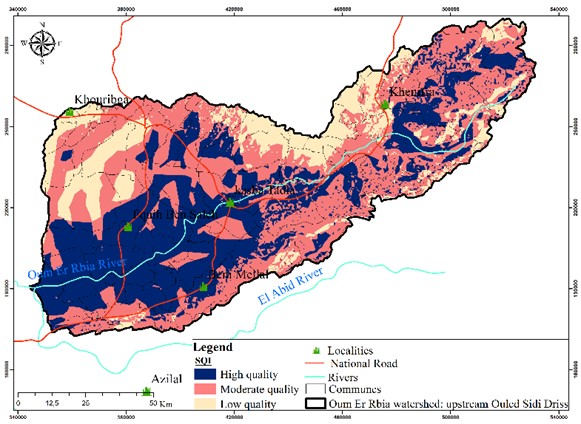
Figure 3 – Soil qualty index (Ourabit et al., 2023a,b)
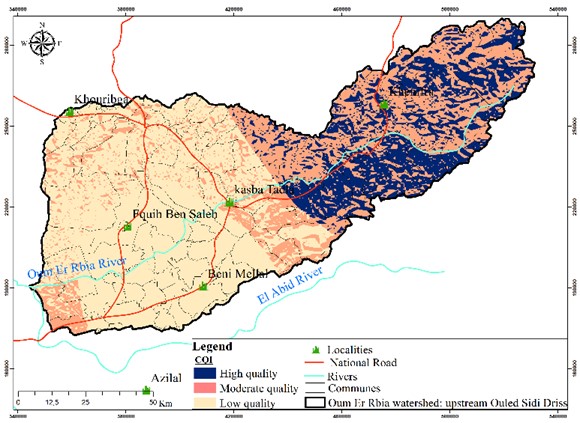
Figure 4 – Climate quality index
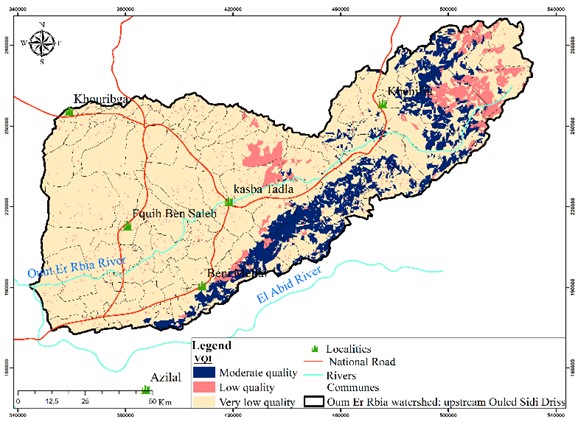
Figure 5 – Vegetation quality index (Ourabit et al., 2023a,b)
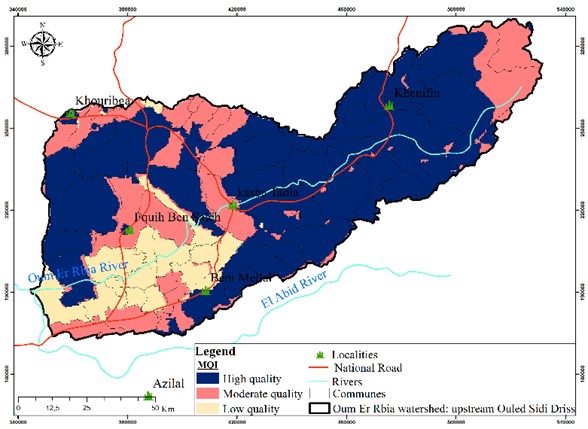
Figure 6 – Management quality index
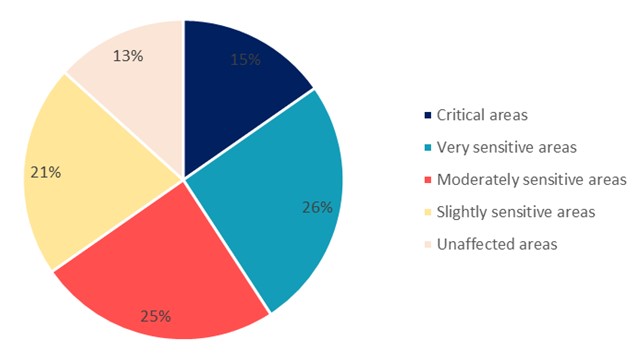
Figure 7 – Distribution of desertification sensitivity in % of the watershed
Table 23
Sensitivity to desertification upstream of the watershed
|
Desertification sensitivity |
Surface area in km² |
Surface area in percent (%) |
|
Critical areas |
2 |
0 |
|
Very sensitive areas |
212 |
2 |
|
Moderately sensitive areas |
1092 |
10 |
|
Slightly sensitive areas |
1905 |
17 |
|
Unaffected areas |
1316 |
12 |
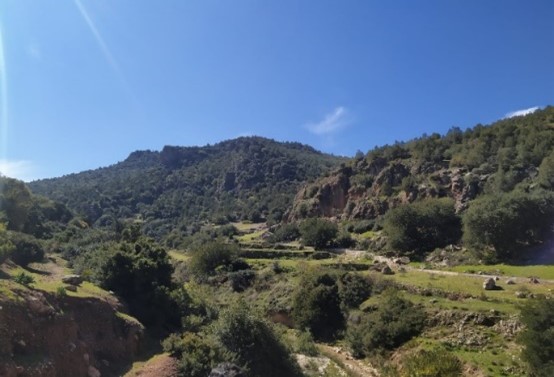
Figure 10 – (Upstream of Watershed), Vegetation Cover
Zooming in on the downstream of the watershed
The downstream of the watershed contains much higher proportions than the upstream, with 38% of the total area covered by critical and highly sensitive zones, followed by moderately to slightly sensitive zones at 18%. By contrast, unaffected zones only account for 1%.
In this part map Figure 11, even though the soil is of good quality, it is more susceptible to desertification, especially in the municipalities located within the irrigated areas of Beni Amir and Beni Moussa (Fquih Ben Saleh, Souk Sabet, Ouled Ayad etc.), where critical zones are more noticeable. Conversely, highly sensitive zones are distributed throughout the downstream area. We can explain this dominance by the poor climatic conditions that prompt the population to intensify irrigation during dry periods. As a consequence, soil salinization occurs. Furthermore, the quality of land management is very low, particularly in terms of agricultural land intensity and livestock numbers. Given the lack of vegetative cover, the lands in this area are more susceptible to this phenomenon.
Table 24
Sensitivity to desertification in the downstream of the watershed
|
Desertification sensitivity |
Surface area in km² |
Surface area in percent% |
|
Critical areas |
1700 |
15 |
|
Very sensitive areas |
2590 |
23 |
|
Moderately sensitive areas |
1578 |
14 |
|
Slightly sensitive areas |
436 |
4 |
|
Unaffected areas |
96 |
1 |
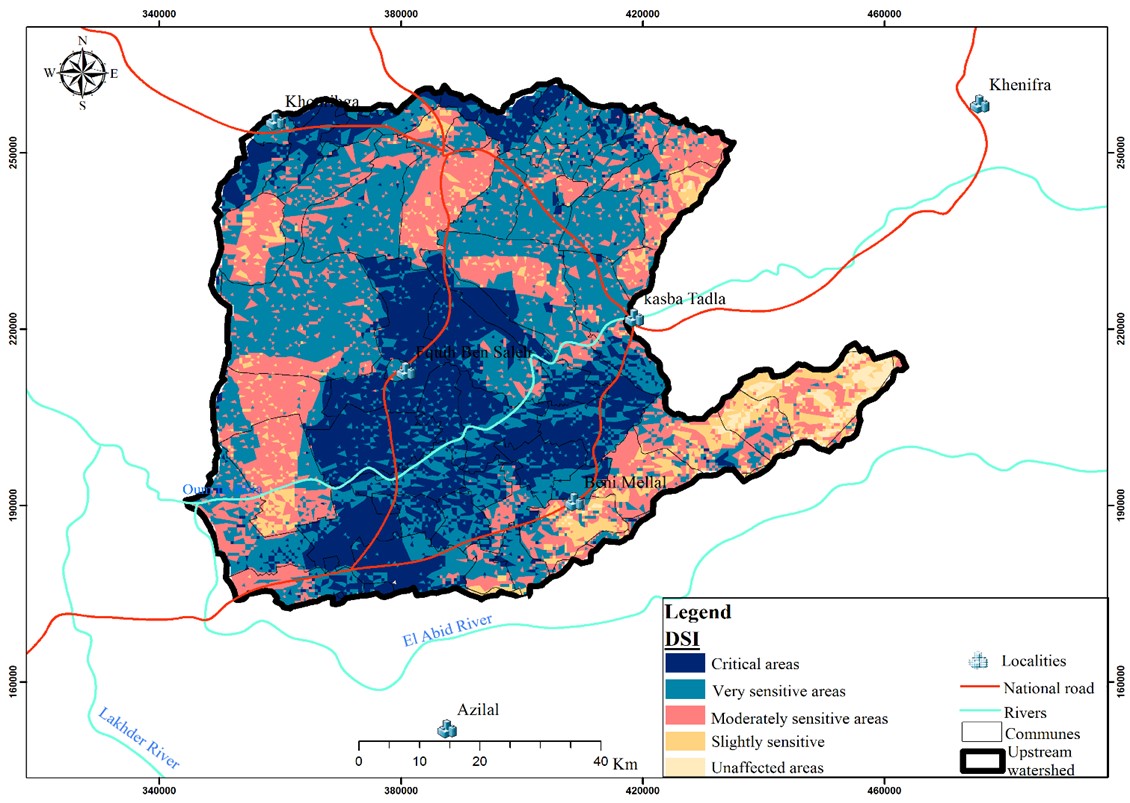
Figure 11 – Spatial distribution of desertification sensitivity in the downstream area of the watershed
Recommendations to fight desertification in the study area
To combat desertification in a given area, it is necessary to first conduct a diagnostic study of its characteristics in order to propose suitable actions for the nature of the territory. In our case, we based our study on the natural and human characteristics, particularly land use, on which we proposed development interventions including good practices that enable harmonious economic and socio-cultural development while ensuring ecological balance and the reproduction and long-term preservation of threatened natural resources (water, soil, flora and fauna). For this purpose, we proposed a development map Figure 13 that includes intervention actions.
Green schools: for effective intervention, it would be desirable to target schools in order to raise awareness among students about the value of natural resources and the importance of their conservation.
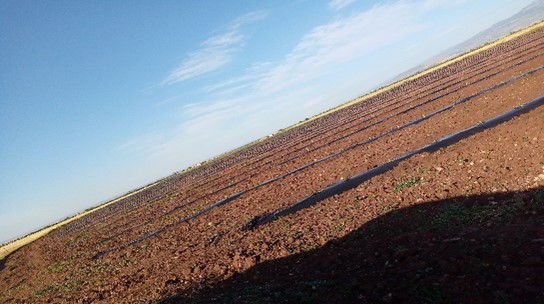
Figure 12 – Irrigated agriculture
The technical manuals and educational kits developed for schools aim not only to inform and raise awareness among teachers and students, but also to reach adults through children (UNESCO and UNCCD, 2001).
Reforestation: aims to restore degraded lands and provides other environmental benefits, such as reducing erosion, controlling salinization and protecting hydrological basins. However, it is important to choose indigenous species adapted to local climatic conditions.
Prohibition signs: including ‘no lighting fires’ and ‘no smoking’ along trails to attract attention and raise awareness among residents about the risk of these behaviours to forest degradation.
Intervention tools: the distribution of tanks, fire hydrants, trails and firefighting stations in various forest areas to facilitate access and intervention in case of fire.
Terraces: creating terraces on slopes and using them for agriculture, in order to restore soils in these areas and reduce the effect of water erosion.
Agroforestry: in bare soils, we have proposed this type of exploitation, which involves combining tree plantations and crops to form complex, multi-species production systems aimed at rehabilitating the land, by creating microclimates through the planting of trees with high resistance to aridity, such as the olive tree. These trees will provide and retain soil moisture and consequently reduce the rate of evaporation, making these spaces cultivable.
Eco-livestock: in areas with a high density of livestock, we have proposed the replacement of livestock that depends on grazing with livestock that depends on forage in order to reduce pressure on the land. In addition, this type of livestock has a higher economic value than other types of grazing animals.
Arboriculture: we have chosen this type of cultivation on the plains, especially in irrigated areas, to help soils restore their resistance. This type of cultivation has the capacity to prevent soil erosion. In addition, it allows for the diversification of plant production and better use of land resources, avoiding overproduction of a single product.
Gabion construction: on steep slopes between mountains where water flows at high speeds, which leads to erosion, transport, and deposition of sediments in areas of lower altitude. To counteract the effect of this process, we propose to strengthen gabion construction in the tributaries that have experienced more erosion.
DISCUSSION
The spatial distribution of desertification sensitivity in the studied watershed varies based on the physical and human characteristics of the area. It can be observed that areas covered with vegetation at higher altitudes are largely dominated by less sensitive or unaffected zones. This can be attributed to the protective role of vegetation against water erosion.
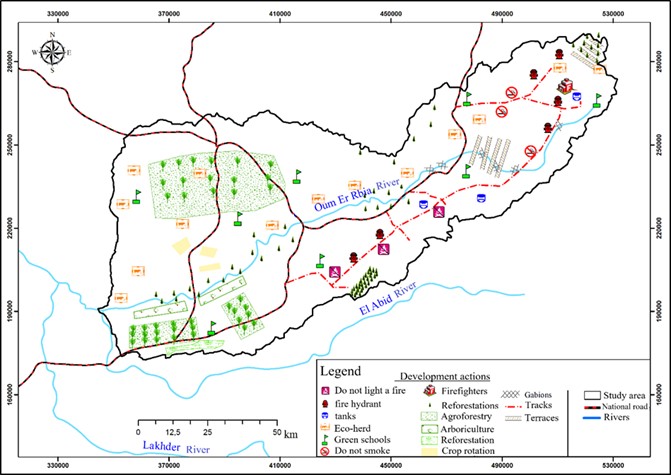
Figure 13 – Proposed development actions in the watershed
Additionally, higher altitudes receive more precipitation than lowlands, resulting in favourable environmental conditions in the upstream part of the watershed, thereby enhancing resistance to degradation factors. Conversely, the downstream part of the basin extending over the Tadla plain is exposed to higher anthropogenic and natural pressures. This is primarily due to extensive agricultural land use and intensive livestock farming. This zone is also more vulnerable due to its lower altitude and lack of precipitation. The obtained results hold significance as they represent the first findings in this field for the Oum Er-Rbia watershed using this methodology. This approach has enabled us to effectively diagnose and characterize the environmental state of this basin, providing crucial information to decision-makers and planners. These data offer in-depth insight into desertification-prone areas and potential degradation factors. This empowers stakeholders to make informed decisions regarding basin management. Given the pivotal role of the Oum Er-Rbia basin in hydrological, tourism and economic aspects, these results serve as a valuable guide for developing strategies to conserve, restore and sustainably utilize the basin’s resources. Based on the results obtained, we were able to formulate best practices aimed at assisting decision-makers in making informed decisions for new developments, considering the risks of soil degradation.
CONCLUSIONS
The impact of climate change on the environment has become an undeniable reality, and with the intensity of human activities, the state of natural resources is very critical in all regions. Heat waves affect soil moisture due to increased evaporation, making land very sensitive and vulnerable to degradation.
The Oum Er-rbia watershed (upstream of the Ouled Sidi Driss hydrometric station) covers an area of 11,152 km² and was chosen as a study area to apply a very precise methodology using the MEDALUS model (Mediterranean Desertification and Land Use) as an important step. We aimed to conduct a rigorous evaluation of soil degradation sensitivity due to the effects of soil, climate, vegetation cover and management systems. The application of this method allowed us to gain insight into the main elements contributing to the onset of desertification, particularly the soil, of which we found 38% to be of good quality. Regarding the climate, 45% of the total watershed area is of good quality. As for vegetation, although this index plays a crucial role in soil protection, we found only 81% of the vegetation to be of very poor quality. The analysis of these results enabled us to obtain the final index of desertification sensitivity, which we established. The results show that 13% of the total area of the watershed covers areas unaffected by land degradation, corresponding to the upstream area of the watershed, where most of the four indices are of good to moderate quality. Conversely, critical to very sensitive areas represent 40% of the watershed.
Author Contributions: Conceptualization and methodology: EGM; Analysis, investigation, writing, review and supervision: OS; Resources and data curation EA. All authors have read and agreed to the published version of the manuscript.
Funding: There was no external funding for this study.
Conflicts of Interest: The authors declare no conflicts of interest.
REFERENCES
Abuzaid, A.S.; Abdelatif, A.D. Assessment of desertification using modified MEDALUS model in the north Nile Delta, Egypt. Geoderma. 2022, 405, 115400. https://doi.org/10.1016/j.geoderma.2021.115400
Benslimane, M.; Hamimed, A.; El Zerey, W.; Khaldi, A.; Mederbal, K. Analysis and monitoring of the phenomenon of desertification in northern Algeria. The Environmental Sciences Review. 2008, 8, 1-9. https://doi.org/10.4000/vertigo.6782
Billaux, P.; Bryssine, E. The soils of Morocco (in French). In Mediterranean Pedology Congress: Excursion to Morocco, Cahiers de La Recherche Agronomique. 1967, 59-101.
Eric, F.; Lambin, H.G. Land-Use and Land-Cover Change: Local Processes and Global Impacts, 1st ed. Springer Berlin, Heidelberg, 2006.
FAO-Unesco. Soil map of the world 1/5000000. United Nations Educational, Scientific and Cultural Organization, Paris, France, 1981.
Courel, M.F.; Bicheron, P.; Mougin, É.; Jarlan, L. PART II Remote sensing and desertification (in French). In Remote sensing in Francophonie: critical analysis and perspectives. Publishing house AUF. 2000, pp. 113-118.
Hassan, Q.K.; Ejiagha, I.R.; Razu Ahmed, M.; Gupta, A.; Rangelova, E.; Dewan, A. Remote Sensing of Local Warming Trend in Alberta, Canada during 2001–2020, and Its Relationship with Large-Scale Atmospheric Circulations. Remote Sensing. 2021, 13, 3441. https://doi.org/10.3390/rs13173441
Tsunekawa, A.; Haregeweyn, N. Soil Erosion and Sustainable Land Management (SLM). Sustainability. 2021, 1-262. https://doi.org/10.3390/books978-3-0365-0787-3
Kosmas, C.; Ferrara, A.M.S.; Briasouli, H.; Imeson, A. Methodology for mapping environmentally sensitive areas (ESAs) to desertification. In The Medalus project Mediterranean desertification and land use. Manual on key indicators of desertification and mapping environmentally sensitive areas to desertification. European Commission, 1999. p. 31-47.
Lahlou, N. Floods in the upper Oum Er-Rbia basin (Upstream Machraa Edahk station) between 1934-2018: identification, measurement, monitoring and extraction (Morocco) (in French). PhD Thesis, Université Sultan Moulay Slimane Béni Mellal (Maroc), Arabic, 2021.
Lahlaoi, H.; Rhinane, H.; Hilali, A.; Lahssini, S.; Moukrim, S. Desertification assessment using MEDALUS model in watershed Oued El Maleh, Morocco. Geosciences (Switzerland). 2017, 7. https://doi.org/10.3390/geosciences7030050
Lee, E.J.; Piao, D.; Song, C.; Kim, J.; Lim, C.H.; Kim, E.; Moon, J.; Kafatos, M.; Lamchin, M.; Jeon, S.W.; Lee, W.K. Assessing environmentally sensitive land to desertification using MEDALUS method in Mongolia. Forest Science and Technology. 2019, 15, 210-220. https://doi.org/10.1080/21580103.2019.1667880
McCoy, R.M. Field Methods in Remote Sensing. The Guilford Press, A Division of Guilford Publications, Inc. 72 Spring Street, New York, NY 10012. 2005, pp.177.
Missante, G.I. The Soils of Tadla and Their Schematic Distribution at 1:500,000 Scale (in French). Al Awamia. 1963, 9, 155-190.
Ourabit, S.; Ettaky, A.; El Ghachi, M. Assessing Vegetation Quality for Soil Protection : A Case Study of the Oum Er-Rbia Watershed, Ouled Sidi Driss Upper. African Journal of Advanced Pure and Applied Sciences (AJAPAS). 2023a, 2, 22-27.
Ourabit, S.; Hamid, M.; Ettaqy, A.; EL Ghachi, M. Assessment of Soil Quality in the Face of Degradation: Case of the Oum Er-rbia Watershed Upstream Ouled Sidi Driss – Morocco (In french). International Journal of Scientific Research. 2023b, 1, 931-938. https://doi.org/10.5281/zenodo.8417114
GIEC. Climate change and emerged lands – Executive Summary for Decision Makers, Climate Change and Land: Special Report by the IPCC on Climate Change, Desertification, Soil Degradation, Sustainable Land Management, Food Security, and Greenhouse Gas Fluxes in Terrestrial Ecosystems (in French). 2020. https://www.ipcc.ch/site/assets/uploads/sites/4/2020/06/SRCCL_SPM_fr.pdf
Sepehr, A.; Hassanli, A.M.; Ekhtesasi, M.R.; Jamali, J.B. Quantitative assessment of desertification in south of Iran using MEDALUS method. Environmental monitoring and Assessment. 2007, 134, 243-254. https://doi.org/10.1007/s10661-007-9613-6
Academic Editor: Dr. Isabela Maria Simion
Publisher Note: Regarding jurisdictional assertions in published maps and institutional affiliations ALSE maintain neutrality.

