F. Rezayi, A. Bahremand, V.B. Shaikh, M.T. Dasturani, M. Tajbakhsh
ABSTRACT. The quantitative and qualitative management of urban runoff is a very complicated, and the importance of it is added every day. Regardless of the economic and social impacts, water engineers always need to know how to respond to a city’s drainage system against different climatic conditions. In this research, the combination of ASSA and GIS models in the returns periods of 2, 5, 10, 50 years were used to determine the flooding points in the 9th district of Mashhad municipality. First, the water-shed boundaries, canals and nodes maps was extracted from the GIS environment. Then, the ASSA model was simulated for a one hour design for a different return period; the outputs of the model were ana-lyzed in the GIS software environment. The results showed that with increasing rainfall return period, 2806 nodes in underground and superficial networks of 114, 178 and 226 nodes were flooded and inundation during the return periods of 2, 5, 50, 10 years, respectively. Field surveys, existing elevation digital maps of the urban runoff network and simulations have shown that the main cause of inundation is the small size of the cross section of the duct, as well as the low slope in some parts of the network. Adaptation of the results of the simulation of rainfall-induced waterlogging in the study area with what happens every year confirms indicates the correctness of the simulations of the model. Moreover, simulation results of the model also showed that there is a good agreement between the simulated results and the measurement.
Keywords: rainfall simulation; urban runoff; drainage network.
View full article (HTML)
Assa models and GIS integration in the determination of flooding point in different return periods
F. Rezayi1*, A. Bahremand1, V.B. Shaikh1, M.T. Dasturani2, M. Tajbakhsh3
1Gorgan University of Agricultural Sciences & Natural Resources, Gorgan, Iran
2University of Ferdowsi, Mashhad, Iran
3University of Birjand, Birjand, Iran
*E-mail: frezayi25@yahoo.com
Received: Oct. 16, 2018. Revised: July 04, 2019. Accepted: July 24, 2019. Published online: Oct. 10, 2019
ABSTRACT. The quantitative and qualitative management of urban runoff is a very complicated, and the importance of it is added every day. Regardless of the economic and social impacts, water engineers always need to know how to respond to a city’s drainage system against different climatic conditions. In this research, the combination of ASSA and GIS models in the returns periods of 2, 5, 10, 50 years were used to determine the flooding points in the 9th district of Mashhad municipality. First, the water-shed boundaries, canals and nodes maps was extracted from the GIS environment. Then, the ASSA model was simulated for a one hour design for a different return period; the outputs of the model were ana-lyzed in the GIS software environment. The results showed that with increasing rainfall return period, 2806 nodes in underground and superficial networks of 114, 178 and 226 nodes were flooded and inundation during the return periods of 2, 5, 50, 10 years, respectively. Field surveys, existing elevation digital maps of the urban runoff network and simulations have shown that the main cause of inundation is the small size of the cross section of the duct, as well as the low slope in some parts of the network. Adaptation of the results of the simulation of rainfall-induced waterlogging in the study area with what happens every year confirms indicates the correctness of the simulations of the model. Moreover, simulation results of the model also showed that there is a good agreement between the simulated results and the measurement.
Keywords: rainfall simulation; urban runoff; drainage network.
INTRODUCTION
In arid and semi-arid climates, rainfall is low, irregular and scattered. Despite low precipitation, a signify-cant part of the rainfall is sudden, unpredictable and short-term and produces relatively high discharge flood events.
Therefore, the identification of area with high flood potential can make an effective contribution to the infrastructure development programs (housing, permeable trenches and parks) and reduce financial losses to different sectors, so the management of surface water in the metropolitan area has particular importance. An intricate term “urban watershed management” has been emerged due to rapid urbanization, i.e. the conversion of non-urban watersheds into urban area and the land-use change from the natural landscape (agricultural, rangeland and forest) to urban (settlements, industrial, commercial, sports, and roads uses). In fact, the flood in the watersheds of the city is happening at high speed on flat and impervious surfaces with artificial drainage system made by humankind.
Regarding this factor, the urbanization of natural area leads to an increase in the volume and intensity of runoff and the occurrence of floods in downstream area (often flooded streets and houses), especially in flat area.
The city of Mashhad is no excep-tion and according to its geographical location, it is located in flood hazard area, and flooding occurrence is usu-ally possible after the events with a return period of 30 or 40 years in this region. In addition, the city of Mashhad is in the southwest of Kashafroud plain and has been affect-ted by flash floods due to the ex-pansion of the plains and alluvial fans under the influence of topographic conditions, high slope and poor drainage during intensive rainfall. The expansion of the city to the south and west and the land-use change of the slope areahves increased the volume of flood in the mentioned region and finally leads to the vulnerability of the city to periodic floods (Hoseinzadeh and Jahaditoroughi, 2007). Due to this matter, in this study, determination of the flood hazard areas at 9th municipality district of Mashhad using the integration of ASSA and GIS models during the return periods (2, 10 and 50-year) was prioritized in this study for some reasons, such as: 1) sensitivity to the flooding event in the upper area of the watersheds, such as Hesar, Golestan, Zoshk, Jaghargh Watersheds, etc.; 2) flood less than 40 years (flood in Abo-Bargh area, Mashhad, 1999); 3) the necessity of the flood control channels; 4) the necessity of the hydrometer station.
Fallah Tafti and Sharifi (2008) simulated and evaluated the perfor-mance of surface runoff drainage system using SWMM model in a part of the urban watershed in southwest of Mashhad. The obtained results indicated that the design of channels were not appropriate for discharge flow.
Dalir (2009) used an integration of MIKE SWMM and ARC VIEW models to simulate the gradual unsteady flow variable in a part of the sewerage network in Mashhad. After flood routing, it was determined that the available sewage capacity was enough for the influx of sewage that was estimated at 2% runoff in the city of Mashhad with a return period of two years.
Badieizadeh et al. (2015 and 2016) determined the optimal dimensions of the drainage network relative to the precipitation of the project with a return period of 2, 5 and 10 years by simulating surface runoff using SWMM model in Gorgan in his research, and concluded that SWMM model has shown relatively good estimation of the flow components and also has good capability in determining the optimal dimensions of drainage channels, so that for the return period of 2, 5 and 10 years, respectively, were 12.48, 30.58 and 40.11% of the length of the network drainage is in critical condition and other parts have good performance during the return period.
Ahmadian (2012), in a research to investigate the reasons for flood occurrence in Imam Hossein Square in Mashhad and after reviewing flood characteristics, physiography, precipi-tation analysis, calculation of the runoff volume and investigation of the flooding accelerated factors, they reached that the main cause of flooding in this field was the entry of surface runoff into the urban sewerage network and of course blockage in sewerage network. Also, the entry of the garbage and waste material of surrounding the streets that caused blockage in the drainage channels and the steepness of the surrounding streets have been due to other flooding factors.
Soleimani et al. (2015), in their study “urban water drainage network rehabilitation solutions evaluation based on risk-based criteria” stated that the proper modification of the existing urban surface runoff drainage networks would reduce the risk of flooding and transporting pollution by flood. Therefore, the adoption of sustainable urban development strate-gies requires an analysis of the quantitative and qualitative water risks in the urban flood.
In the present study, three following strategies for improving drainage network were evaluated: 1) traditional approach (increasing the dimensions of the channel); 2) using the garden waterway; 3) applying a biological residue system using three criteria, including the risk of flooding in different parts of the network and the risk of flood contamination and the cost of network reconstruction. Finally, these strategies were priori-tized using multiple-criteria decision-making analysis method. The results show that garden waterway system can be described as the best solution at a cost of approximately 20 billion Rials (1 USD = 41,949.67 Iranian Rial), that can reduce the risk of flood quantity (flooding) by 59% and the risk of quality (contaminants) by 26% relative to existing conditions.
MATERIALS AND METHODS
The city of Mashhad is located in the north-eastern part of Iran with mild climate and tend to be cool and dry. Mashhad surrounded from north, east and west to Toos plain and south to Binalood highlands. Mashhad is divided into 13 municipality districts, of which 7, 8 and 9 are in the vicinity of southern highlands. A quarter of area 9 in the southwest of Mashhad is on a slopes of highlands and has a fairly steep slope. During rainfall, runoff from this area is flowing from the surface of the upstream area to the city area and is eliminated through natural streams. This research was carried out at 9th municipality of Mashhad for some reasons, such as: 1) vulnerability and flood hazard from highlands areas; 2) flood history less than 40 years; 3) having fairly regular channels. In Fig. 1, the geographic coordinates of the study area are presented.
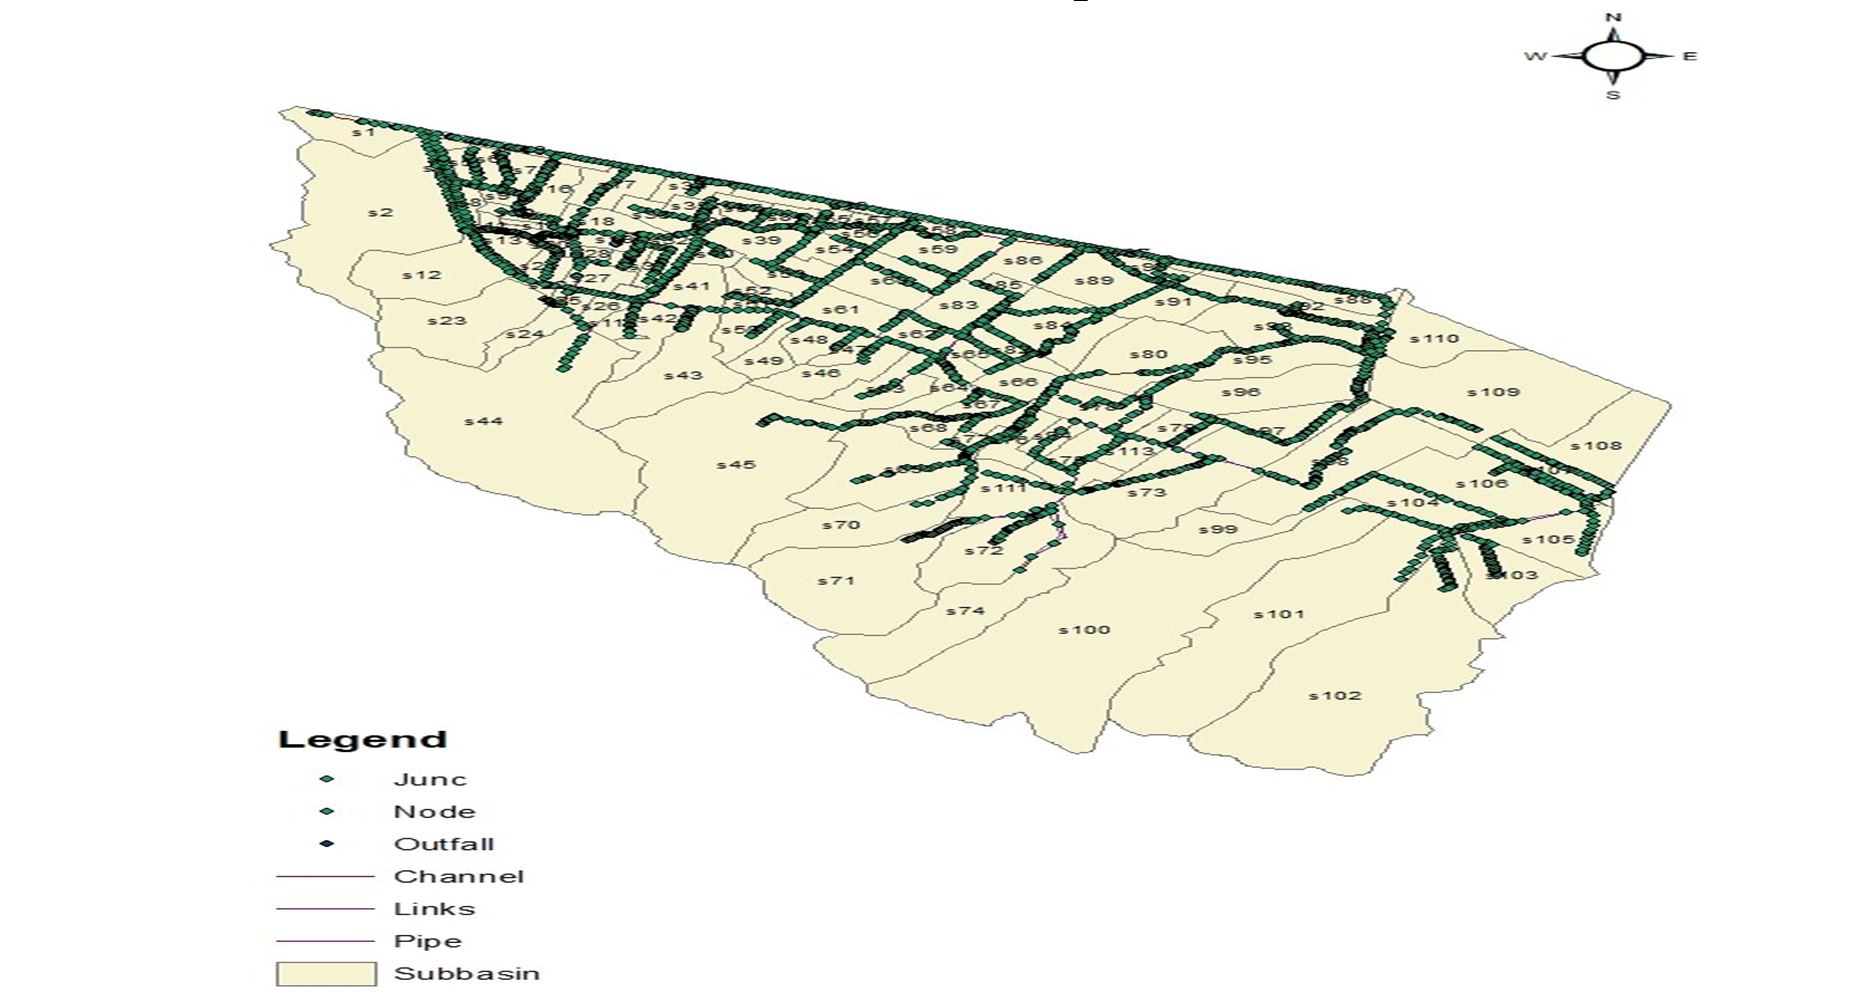
Figure 1- Map of the study area and the sub catchment border
On the other hand, in the study area, as illustrated in Fig. 1, it is clear that the network of highways and urban roads plays a special role in guiding and spreading floods to the other urban area. In other words, in most of the study area, drainage channels and canals are perpendicular to the streets, which intensify flooding, so the simulation at 9th municipality district of Mashhad is preferable.
Research methodology
In this study, the boundaries of the sub-watersheds, channels and nodes were prepared in GIS firstly, which are considered as input physical elements to ASSA model, and then the outputs of ASSA model were analyzed in GIS software (Fig. 2).
ASSA model is an advanced, powerful, and comprehensive modeling package for analyzing and designing urban drainage systems, urban runoff and sanitary sewage. The functionality of this software is to support hydrological, hydraulic and water quality models simultaneously in two American and metric units, which includes a set of hydrological and hydraulic models. This model includes a set of hydrological and hydraulic models that the latest version of SWMM with a lot of capabilities is being replaced every year in order to simulate runoff.
Required data for ASSA model (CivilStorm)
The required inputs for the model are: physical characteristics of the sub-watersheds, the drainage network characteristics, and meteorological and hydrological data of the study area, as follows.
|
collecting, investigation, processing, and data analysis |
|
similar area, hydrologic watersheds, and boundaries |
|
model and simulation |
|
calibration sensitivity analysis |
|
validation |
|
model evaluation (with analyzing uncertainty and the error in the prediction of the model) |
|
determination of the critical and flood hazard area by using ASSA model in GIS and the processing of the results |
Figure 2 – Diagram of the research methodology ASSA model
Determination of the boundary of the watershed and sub-basins. In order to determine the boundaries of the urban sub-watersheds, topographic maps with a scale of 1: 2000, map of the canal’s paths, drainage channels and map of building blocks were used from the department of roads and urban development municipal-lity of Mashhad. Then, based on the direction of runoff on all the passages (main and sub-routes of canals and waterways), sub-basins were determined and finally 113 sub-basins were considered for this study area.
First of all, the boundary of the watersheds was prepared and their latitude and longitude were identified. In some sub-basins, part of the runoff enters into Kal-e Chehel Baze, and the other part joins the surface runoff drainage network and exits the outlet. In addition, in each block, there are usually two rows of house in which the runoff of houses enters the alley overlooking the same row, so the common area of the two rows of the house is considered as the lateral boundary.
Roughness coefficients and surface storage in permeable and impervious area and the percentage of impervious area without surface storage of observational data integration and land use maps in ArcGIS software were obtained.
Drainage system data. To calculate the characteristics of the waterways, such as the length of channels, roughness coefficient, cross-sectional shape, and width of the channel were recorded in the study area.
Required information for fittings. Specifications of fittings and runway entry points of each sub-area were identified in the drainage network through field observations and their character-ristics, such as floor elevation, latitude and longitude, and maximum depth of connections using GIS.
Meteorological and hydrologic data. This information includes rainfall (single event or continuous), monthly evaporation, wind speed, as well as snow data. Considering the assumptions of using the model for the storm event, some of the above information has no major impact and sensitivity on results of the model. However, this information has been replaced with the assumption of the storm event in the model, as follow. According to the assumptions and possi-bilities of the model in terms of temperature, the lack of information has been used. In order to calculate evapo-ration and by regarding the time of storms that is measured in winter, it has been supposed the evaporation rate to be zero.
Since runoff estimation in ASSA model and other urban runoff models are based on rainfall data, therefore this data is one of the most important and basic information used by the model. In this research, six storm events were used to evaluate and calibrate the model.
ASSA model sensitivity analysis
To analyze the sensitivity of the existing parameters, eight parameters were selected, such as: the percentage impervious area, manning roughness coefficient of permeable and impervious area, equivalent width, the height of storage permeable and impervious area, slope map and the percentage of impervious without surface storage. Among different results of SWMM model, the peak flood discharge, which is the most effective parameter, is considered as a dependent variable to study.
For sensitivity analysis, the design rainfall was used in the return period of 25 years (1.20). Each of the eight mentioned parameters in all sub-watersheds was 5±, 10±, 15±, and 30±percent of the initial values of reduction and increase and will be calculated by varying the value of each parameter and their effect on the peak flood discharge. Initial parameters and their range of changes have been shown in Table 1.
Calibration and validation of ASSA model
In order to calibrate the model, four events were selected, such as 20/10/1393, 11/6/1393, 12/22/1393 and 15/12/1393, and to evaluate the model two events were used: 1394/13 and 11/1/1394. It should be noted that since there was no hydrometric measuring station to determine the discharge inside the city, the velocity and height of the runoff correspond-ding to these storms in 2526 channel were calculated using calibrated Rod Ruler.
Table 1
The primary amount and variation range of the main parameters used in ASSA model
|
Coefficient |
Initial values |
Allowed modification range |
Reference |
|
percentage of impervious area |
– |
30± |
Temprano et al. |
|
Slope (%) |
– |
30± |
Temprano et al. |
|
width equivalent (m) |
– |
30± |
Temprano et al. |
|
Manning roughness coefficient impervious area |
013/0 |
033/0-011/0 |
Huber and Dickinson |
|
Manning roughness coefficient permeable area |
05/0 |
8/0-02/0 |
Huber and Dickinson |
|
height of water storage of impervious area(mm) |
778/1 |
5/2-3/0 |
Huber and Dickinson |
|
height of water storage of permeable area (mm) |
81/3 |
1/5-5/2 |
Tsihrintzis and Hamid |
|
percentage of impervious area without surface storage |
16 |
20-5 |
Huber and Dickinson |
The design rainfall. In order to determine the rainfall, the time of concentrations necessary at first.
A field method based on measuring the time spent by water and the calibrated Rod ruler were used to calculate the time of concentration (Badieizadeh et al., 2015 and 2016). Then, cumulative rainfall was calculated using the intensity-duration-frequency curves. Finally, using the alternating block method, the storm hyetographs in the 25-year return period were introduced as input to the model. The rainfall data of Mashhad synoptic station was used in this study.
The value of NS can be positive or negative and when it is equal to 1 is the best condition. If the value of NS is positive, the simulated data is better than the average observational data, and if it is negative, it indicates that the output of the model is not the equal with the nature of the system (Muleta et al., 2006 and Karimi et al., 2015). The lowest acceptable NS value is 0.5, and whatever the value of NS is close to 1; indicates the high accuracy of the simulation (Pathirana et al., 2013). Also, the difference between the observed andestimated data is less and the prediction accuracy of the model will be higher when RMSE is smaller. The total error is in the flow volume, and the positive and negative values of this coefficient indicate that the volume average of the simulated flow is more or less by the model to the observational flow (Chen et al., 2009).
Kling-Gupta efficiency (KGF)
This criterion is the latest evaluation criterion for comparing simulated and observed hydrographs. Gupta et al. (2009) have introduced this index and compared its advantages with the famous Nash-Sutcliff criterion. This criterion was revised and applied by Kling et al. (2012).
In this formula, r is the correlation coefficient between simulation and measurement data. α is the standard devi-ation of simulation values to the standard deviation of measured values. β is the average of simulation values to the average of observational values. The best value for the Kling-Gupta efficiency (KGF) is the number 1, which indicates the complete matching of the hydro-graphs. In the revised criterion of the Kling-Gupta efficiency (KGF); γ is used instead of α, which is the variation coefficient rate of the simulation values to the variation coefficient rate of the observational values (Kling et al., 2012)
The efficiency evaluation criterion of ASSA model. In this study, only six storm events were selected; four of which were calibrated and two were used for validation of the model.
The most common mathematical functions used in most urban hydrological studies are the Nash-Sutcliff coefficient, RMSE and the Kling-Gupta efficiency (Dongquan et al., 2009). In this study, four criteria were used to investigate the accuracy of calibration and validation of the model.
RESULTS AND DISCUSSION
In recent years, the use of GIS and its integration with hydrological (Scott, 2006) and hydraulic models in the complex metropolitan watersheds has been increasing to gain more accurate results and has led GIS to play a key role in rainfall-runoff studies in urban watersheds.
In addition, the development of GIS techniques and the use of tools, such as land use map, the map of im-pervious area, digital elevation model (DEM), digital air photography, elevation map and drainage network map can provide input parameters for hydrological and hydraulic models (Muleta et al., 2006).
In the present study, ASSA model was applied for rainfall-runoff modeling. The obtained results indicate that ASSA model has the capability of transmitting data and information directly from GIS; it means that the required information of the model with its format has the capability of transmitting, and vice versa, the outputs of the model can be analyzed in GIS environment and increase the speed of computing and simulation. In this research, the map of sub-watersheds, channels, and nodes were modeled as the main elements of the model directly in GIS and with regard to the time of the concentration of the watershed, rainfall hyetographs were obtained and the model was simulated for design rainfall with a return period of 2, 5, 10, and 50 years.
Sensitivity analysis is a method that indicates which of the parameters has more severe effect on the results. The ranking of the model parameters based on their participation in the model can be calculated altogether. In this study, absolute sensitivity analysis method was applied to investigate the sensitivity of the rainfall-runoff model; in this way, the eight effective parameters of the initial value presented in Table 1, ±5, ±10, ±15, and ±30 percent has been decreased and increased and the model was implemented for them. This study was carried out using generated hyetographs with the return period of 25-year by periodic block method for the whole watershed and the model was implemented 64 times in total. For example, if the equivalent width of the sub-watersheds is reduced by 15% and the rest of the parameters remain constant, the peak discharge value is reduced by 1.15%. The results of the sensitivity analysis of the model are shown in Figs. 3 to 8. The variation of roughness coefficient and storage height in permeable area had no significant effect on the peak discharge.
The rest of the parameters included the percentage of changes in the impervious land, the slope, the equivalent width and the impervious area without surface storage have had uptrend of peak discharge, and the percentage of changes of Manning’s roughness coefficient and the storage height in the impervious area have had an inverse trend with peak discharge.
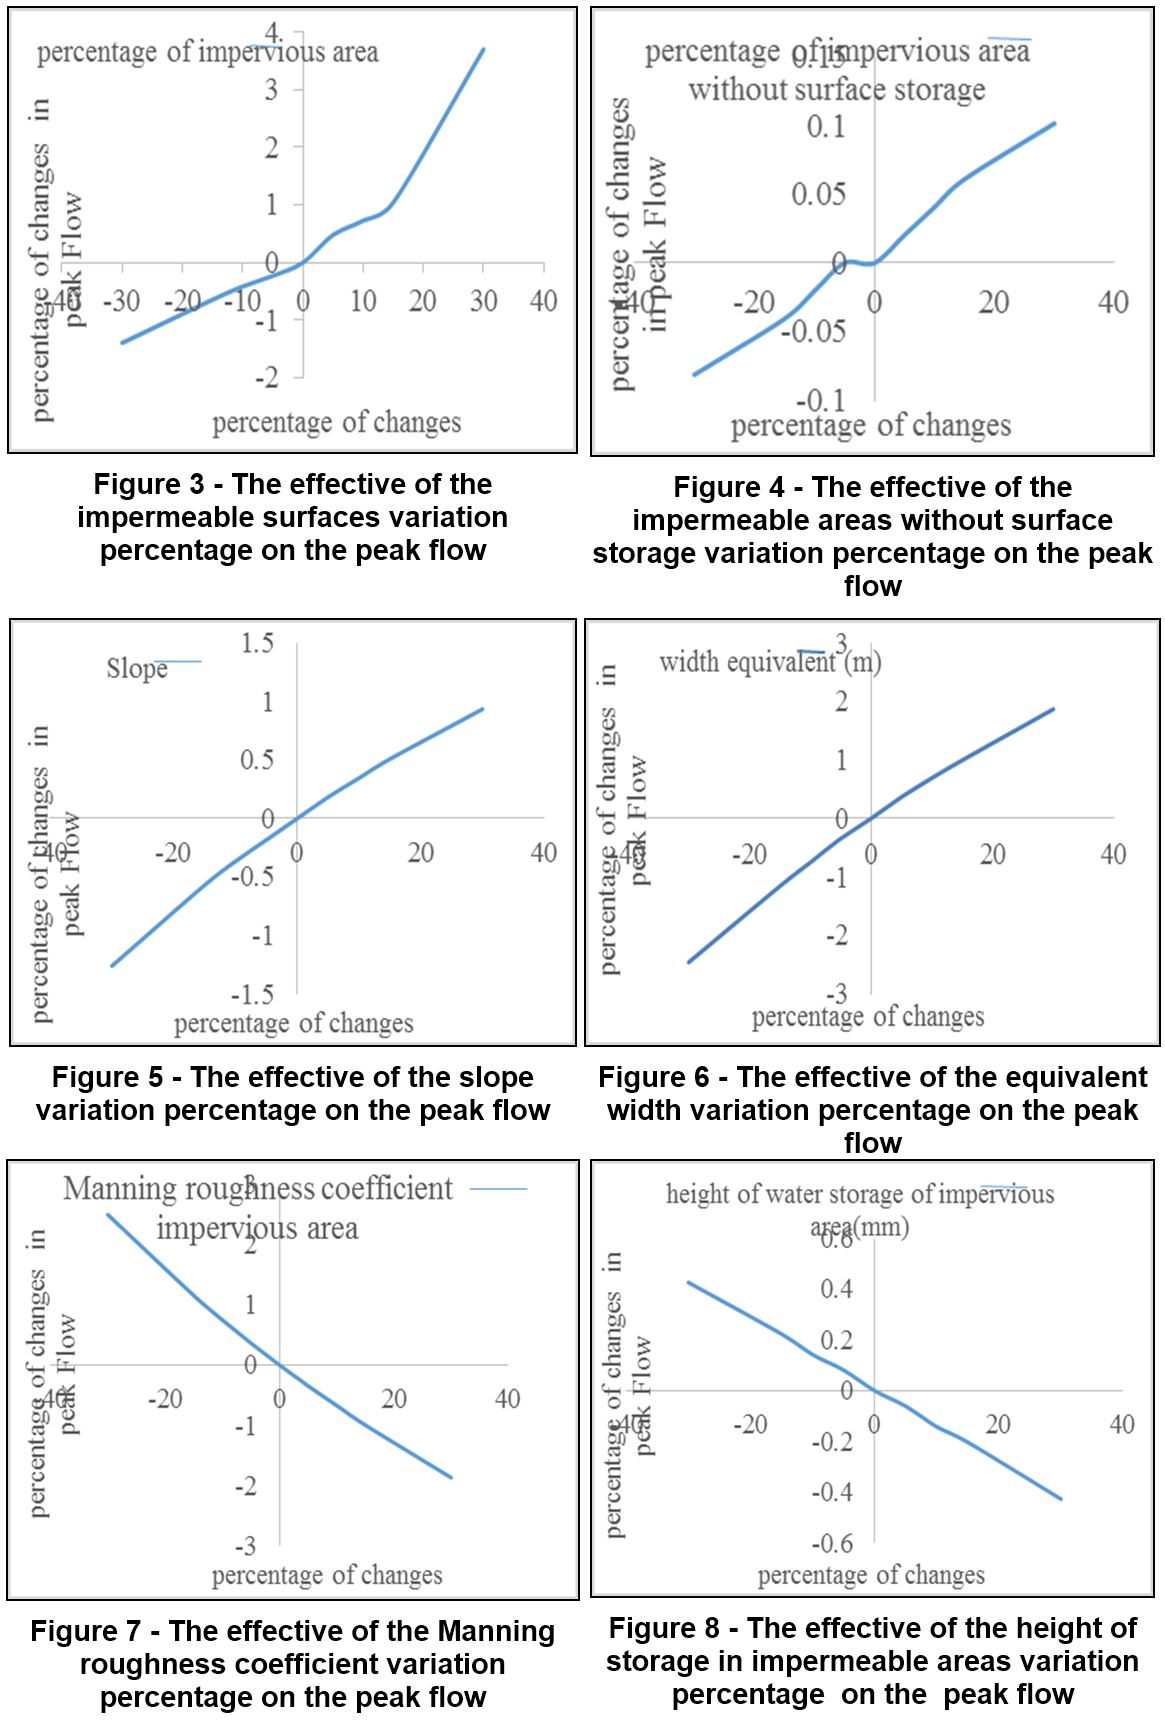
According to the Figs. 3 to 8 and the obtained results, it is clear that among eight used parameters, the percentage of the impervious area has the most important effect on the peak discharge rate of the urban area, after which Manning’s roughness coeffi-cient parameter in permeable area, equivalent width, slope, storage height in impervious area and impervious area without surface storage had been in the next rank which is the same as research of Seth (2006). Ahmadian (2012), using SWMM model in Hashtgerd-e Jadid area, examined eight parameters (the percentage of the impervious area, Manning’s roughness coefficient of the imper-vious and permeable area, the equivalent width, the storage height of the impervious area, the storage height of the permeable area, the slope of the sub-watershed, and the percentage of impervious area without surface storage) and stated that Manning’s roughness coefficient in the impervious area, equivalent width, the slope of the sub-watershed and the percentage of the impervious area have had the most effect on the peak discharge variation, respectively. While in the present study, as shown, the order of the parameters sensitivity is different, and also the slope is considered as a parameter with low sensitivity; this result can be attributed to the physical properties of the two study area. The statistical results of the calibration process of ASSA model have been presented in Table 2. The results of the validation of the model are shown in Table 3 and Fig. 9.
Table 2
Calibration results of ASSA model
|
Rainfall precipitation date |
Index Nash |
RMSE |
BIAS, % |
KGE |
|
10/1/2015 |
./85 |
./6 |
-16/73 |
0./767 |
|
15/2/2015 |
./87 |
./65 |
8/56 |
0/855 |
|
21/2/2015 |
./8 |
./58 |
-25/5 |
0/76 |
|
6/3/2015 |
./63 |
./91 |
-12/5 |
0/61 |
Table 3
Validation results of ASSA model
|
Rainfall precipitation date |
Index Nash |
RMSE |
BIAS, % |
KGE |
|
27/3/2015 |
./6 |
./61 |
21/65 |
0/77 |
|
31/3/2015 |
./61 |
1/14 |
12/43 |
0/74 |

Figure 9 – Validation results of the observational and simulated hydrographs of the discharge for the fifth event
The obtained results of the model calibration showed that the discharge simulation in the investi-gated events has good adaptation with the observational data. The NS value for events is more than 0.5. The results of the ASSA model evaluation Table 3 confirm the efficiency and accuracy of the model with NS value more than 0.5. Also, RMSE values for simulation events of the calibration and evaluation of ASSA model were 0.6, 0.65, 0.58, 80.91, 0.61 and 1.14, respectively, and the value of the Kling-Gupta efficiency (KGF) for simulation events of calibration and evaluation of ASSA model was 0.76, 0.85, 0.76, 0.61, 0.77, and 0.74 respectively, indicating the acceptable results of the model, and also shows that the model has the ability to simulate surface runoff, which shows agreement with the findings of Badieizadeh et al. (2016), who applied the mentioned model in the runoff simulation of Gorgan city in the north of Iran. They concluded that SWMM model has the required accuracy to simulate the surface runoff and also it shows agreement with the findings of Karimi et al. (2015), in the quantitative simulation of flood event in parts of the urban watershed in Babolsar.
They found that the simulation of flooding caused the design rainfall in the study area using the SWMM model is suitable. The obtained results of the calibration and evaluation of the model showed that the simulation of the six investigated events is in high agreement with the average value of the Nash-Sutcliff coefficient and the evaluation criteria of Kling-Gupta efficiency (KGF) for the investigated events are 0.72 and 0.75, respectively.
The results of the evaluation of the ASSA model confirm the efficiency and accuracy of the model, which measures the above mentioned criteria to be higher than 0.5. Also, the mean squared mean square error for existing events is 74, which represents the acceptable results of this model. As a result, it can be said that there is a good correlation between simulated and observed runoff and this can indicate that the ASSA model has the accuracy required for urban runoff simulation, and this model can be used for urban runoff management projects and urban runoff drainage network design.
The study area is consistent with the findings of Karimi et al. (2015) and Badieizadeh et al. (2016). In Fig. 9, the results of the zoning are presented as outputs of ASSA model in GIS software for the study area for a one hour storm event in the return periods of 2, 5, 10, and 50 years.
Table 4
Length and percentage of flooding in the study area
|
Return period |
Length and percentage of flooding |
|
|
M |
% |
|
|
2-year |
950/74 |
1/81 |
|
5-year |
1532 |
2/91 |
|
10-year |
2277/65 |
4/33 |
|
25-year |
2706/88 |
5/15 |
|
50-year |
2774/47 |
5/28 |
|
100-year |
2917/57 |
5/55 |
|
200-year |
3131/92 |
5/96 |
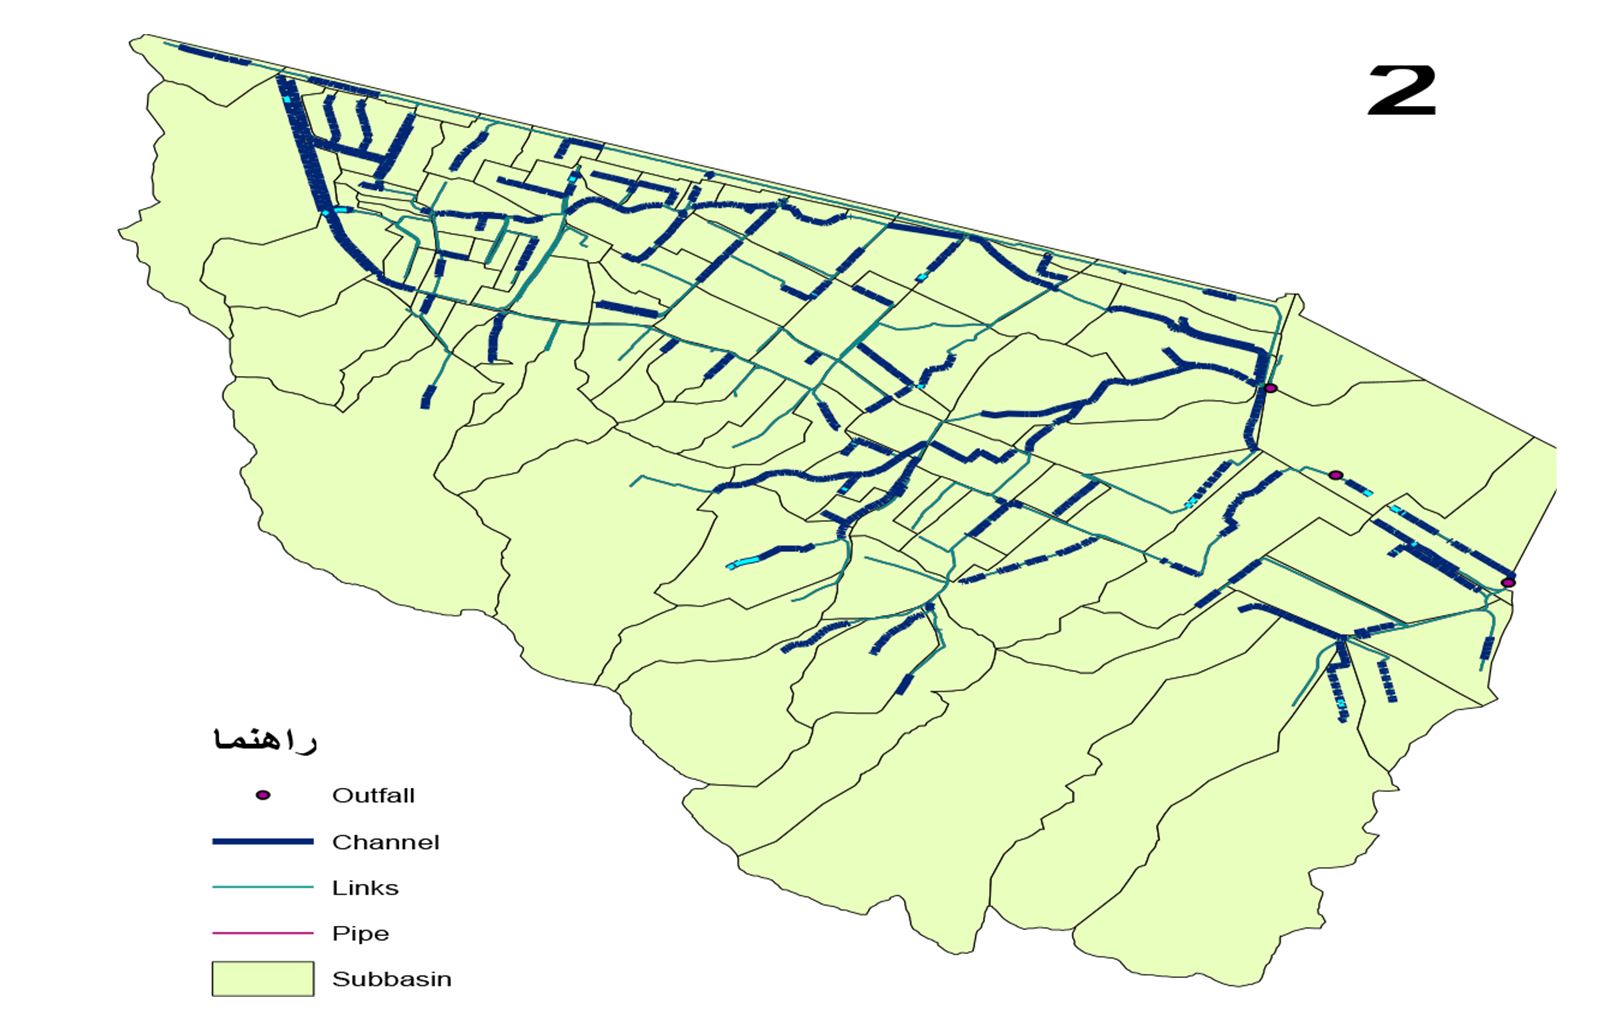
Figure 10 – Flooding point accurate determine with 10 years return period in the GIS environment according to ASSA model outputs
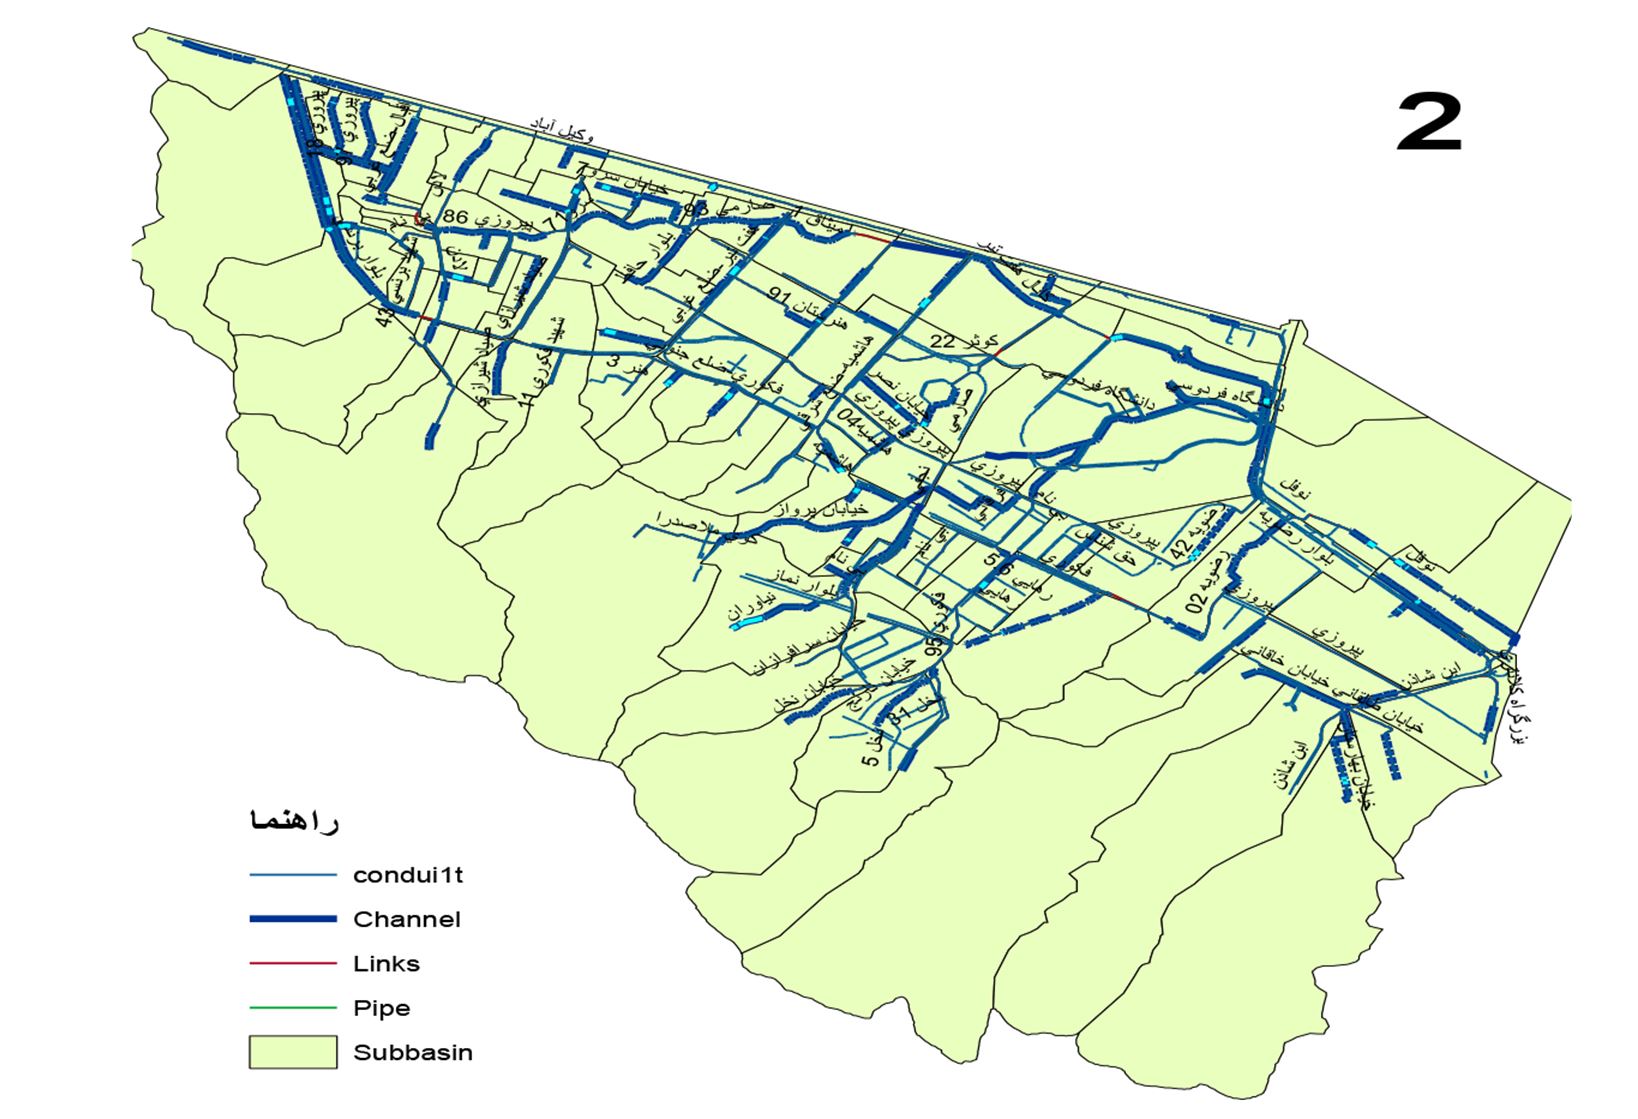
Figure 11 – Flooding point accurate determine with 100 years return period in the GIS environment according to ASSA model outputs
As shown in Table 4 and figures of the simulations (Figs. 10 and 11), for 2-year return period, 1.81% of the drainage network is in critical condition and for the return period of 5, 10, 25, 50, 100, and 200 years, respectively 2.91, 4.33, 5.15, 5.28, 5.55, and 5.96% of the network are in critical and flooded conditions, and moreover, there are also channels that have a flooding problem, as shown in the table above that are matched with the results (Badieizadeh et al., 2016). Also, in addition to the critical channels, the flooding points or nodes with different return periods in the model and finally their outputs have been estimated in GIS software and the results showed that with increasing rainfall return period, among of 2806 existing nodes in the underground and surface drainage network; 114, 178, and 226 nodes during the return periods of 2, 5, 10, 50-year, respectively, were flooded.
CONCLUSION
The first issue in hydrological models is the precise determination of the boundary of watersheds and sub-watersheds. In this study, land use map was prepared then according to GIS other necessary parameters base on rainfall-runoff models, such as: area, width equivalent, the mean slope, and percentage of impervious area were performed.
This research represented that ASSA model has the direct capability of transmitting data and information from GIS, which means that the required information of the model is in a form that can be transmitted. Other wise, any information related to sub-watersheds, channels, and nodes must be entered manually, which is a very time-consuming and costly task. This is the most important feature of the model, which is much more user-friendly, less costly and more accurate than ASSA model.
In this study, ASSA model was used to simulate one hour storm event with return period of 2, 10, 50 years. Among 2806 existing nodes in the underground drainage network, 114,178 and 226 nodes with 2, 10 and 50-year return period were flooded. According to the field studies, existing maps of the digital elevation model of the urban runoff network and simulations done have shown that the main cause of flooding events is the smallness of the cross section of the waterways, as well as the low and high slope in some parts of the network. The adaptation of the simulation results according to the design rainfall in the study area with what happens every year shows the validity of the model simulations.
REFERENCES
Ahmadian, M. (2012). Evaluation of urban runoff with using the SWMM model to reduce flood Hazard (Case study: Hashgrd New Town). Master’s thesis, Science and Research Islamic Azad University, 150 p. (in Persian).
Badieizadeh, S., Bahremand, A.R., Dehghani, A.A. & Nora, N. (2015). Urban flood management through surface runoff simulation to use SWMM Model in Gorgan city, Golestan province. J. Soil Water Conserv., 22(4): 1-16 pp. (in Persian with English abstract).
Badieizadeh, S., Bahremand, A.R. & Dehghani, A.A. (2016). Calibration and evaluation of the hydrologic-hydraulic Model SWMM to simulate runoff (case study: Gorgan). J. Watershed Manag.Res., 7(14): 1-10 (in Persian with English abstract).
Chen J., Hill, A.A. & Urbano, L.D. (2009). A GIS-based model for urban flood inundation. J.Hydrol., 373(1-2): 184-192, DOI: 10.1016/ j.jhydrol.2009.04.021
Dalir, A. (2009). Simulation of sewage network performance during rain fall using of MIKE SWMM and Arc view model combination (case study partial of Mashhad sewage network), Master’s thesis, Water trend, Ferdowsi University of Mashhad, 195 p.
Dongquan, Z., Jining, C., Haozheng, W., Qingyuan, T., Shangbing, C. & Zheng, S. (2009). GIS-based urban rainfall-runoff modeling using an automatic catchment-discretization approach – a case study in Macau. Environ. Earth Sci, 59: 465-472.
Gupta, H.V., Kling, H., Yilmaz, K.K. & Martinez, G.F. (2009). Decompo-sition of the mean squared error and NSE performance criteria: implica-tions for improving hydrological mo-delling. J.Hydrol., 377(1-2): 80-91. DOI: 10.1016/j.jhydrol.2009.08.003.
Fallah Tafti, A. & Sharifi, M.B. (2008). Simulation of surface runoff drainage network using GIS and MIKE SWMM integrated model case study: water and power catchment, Mashhad. Iranian Hydraulic Conference Seventh.
Hosein Zadeh, S.R. & Jahadi Toroughi, M. (2007). The Mashhad city preceding effects of the natural drainage pattern and urban flooding intensify. Geographic Studies, 61: 145-159 (in Persian with English abstract).
Karami, M., Ardeshir, A. & Behzadian, C. (2015). The flooding risk management and pollution caused by urban flood using modern and modern optimal solutions. Iranian Water Resources Research Journal, 11th Year, No. 3 (in Persian with English abstract).
Kling, H., Fuchs, M. & Paulin, M. (2012). Runoff conditions in the upper Danube basin under an ensemble of climate change scenarios. J.Hydrol., 424-425: 264-277, DOI: 10.1016/ j.jhydrol.2012.01.011
Muleta, M.K., Boulos, P.F., Orr. C.-H. & Ro J.J. (2006). Using genetic algorithms and particle swarm optimization for optimal design and calibration of large and complex urban storm water management models. Proceedings of World Environmental and Water Resource Congress.
Soleimani, M, Behzadian, C. & Ardeshir, A. (2015). Urban waters drainage network rehabilitation solutions evaluation based on risk-based criteria. Journal of Water and Sewage, 6: 14-19 (in Persian with English abstract)
Bahremand A., Dasturani M.T., Rezayi F., Shaikh V.B., Tajbakhsh M.

© by the authors; licensee Journal of Applied Life Sciences and Environment, Iasi, Romania. This article is an open access article distributed under the terms and conditions of the Creative Commons Attribution License (http://creativecommons.org/licenses/by/4.0)
