R.O. Babatunde, A.E. Omoniwa, A.O. Adekunle, G.T. Oyeleke
ABSTRACT. Food and nutrition security remain Africa’s most fundamental challenge for human welfare and economic growth. In this study, recent survey data from Osun State, Nigeria, was used to examine the effect of food expenditure on farming households’ welfare in Nigeria. Logistic and OLS regression models were the analytical tools used. Food Insecurity Gap (FIG) and Squared Food Insecurity Gap (SFIG) were used to capture the severity of food insecurity among the households. The results showed that, all households sampled consume rice, beans, vegetable, fish and oil as basic food items, while only 32% of them consume potatoes. The regression results showed that the household size, per capita income, dependency ratio and age were the highly significant factors influencing food expenditure. However, the coping strategy that was mostly adopted by the farmers in the study area was to cut down on the numbers of food items consumed. Therefore, it was recommended that farm mechanization should be encouraged for optimal land use and productivity. In all, promoting agricultural policies with appropriate price incentives that focus on intensification, diversification and resource-stabilizing innovations will create more wealth for all categories of farming households and this in turn will ensure food security, especially in an era of economic deregulation.
Keywords: food Insecurity; per capita expenditure; welfare; innovations; intensification.
View full article (HTML)
Effect of food expenditure on farming households’ welfare in Osun state, Nigeria
R.O. Babatunde1,*, A.E. Omoniwa1, A.O. Adekunle1, G.T. Oyeleke1
1University of Ilorin, Department of Agricultural Economics and Farm Management, Ilorin, Kwara State, Nigeria
*E-mail: babatunde.or@unilorin.edu.ng
Received: July 14, 2018. Revised: Oct. 24, 2018. Accepted: Nov. 19, 2018. Published online: Oct. 10, 2019
ABSTRACT. Food and nutrition security remain Africa’s most fundamental challenge for human welfare and economic growth. In this study, recent survey data from Osun State, Nigeria, was used to examine the effect of food expenditure on farming households’ welfare in Nigeria. Logistic and OLS regression models were the analytical tools used. Food Insecurity Gap (FIG) and Squared Food Insecurity Gap (SFIG) were used to capture the severity of food insecurity among the households. The results showed that, all households sampled consume rice, beans, vegetable, fish and oil as basic food items, while only 32% of them consume potatoes. The regression results showed that the household size, per capita income, dependency ratio and age were the highly significant factors influencing food expenditure. However, the coping strategy that was mostly adopted by the farmers in the study area was to cut down on the numbers of food items consumed. Therefore, it was recommended that farm mechanization should be encouraged for optimal land use and productivity. In all, promoting agricultural policies with appropriate price incentives that focus on intensification, diversification and resource-stabilizing innovations will create more wealth for all categories of farming households and this in turn will ensure food security, especially in an era of economic deregulation.
Keywords: food Insecurity; per capita expenditure; welfare; innovations; intensification.
INTRODUCTION
In Africa, far too many people on the continent are unable to acquire and effectively utilize at all times the food they need for a healthy life.
This is because of low food availability and profound poverty with about 200 million people on the continent undernourished, and their numbers have increased by almost 20% since the early 1990s (Benson, 2004). Food insecurity has emerged as a major problem facing developing countries. Despite a reduction in the global prevalence of malnutrition from 20% in 1990-1992 to 16% in 2010, an estimate of 795 million people in the world still does not have enough food to lead a healthy and active life. Of these people, 12.9% lives in developing countries with vast majority in sub-Saharan Africa, including Nigeria (Akanbiemu et al., 2016).
Food security refers to the condition in which all people, at all times, have physical, social, and economic access to sufficient, safe and nutritious food that meets their dietary needs and food preferences for an active and healthy life (FAO/WHO,1992; FAO,1996).
There are four dimensions to this: 1) availability of sufficient amount of food, which is a function of food production; 2) stability of supply over time, which depends on the ability to preserve/store produced food and supplement available food through imports if necessary; 3) access to the available food, which depends on income levels and its distribution and 4) food utilization, which encompasses procurement, ingestion and digestion, all of which are dependent on nutritional quality, education and health (Tollens, 2000). However, notwithstanding the many policies, programs, and investments by various local and international agencies operating in the country, food security and the nutrition situation are worsening (FEWSNET, 2007). Inconsistent food security results in inadequate dietary intake, which leads to malnutrition. Malnutrition is the most serious consequence of food insecurity. Adult malnutrition results in a lower productivity on farms and in the labour market. In women, it also results in foetal malnutrition and low birth weights. Foetal and infant under nutrition leads to lower cognitive development and poor schooling performance. For school-age children, nutritional deficiencies are respon-sible in part for poor school en-rolment, absenteeism, early dropout, and poor classroom performance with consequent losses in productivity during adulthood (Akinyele, 2009). Food insecurity may motivate participation in armed civil conflict at the individual level. It can also be a source of grievances and motivate individual participation in rebellion in some instances (Hendrix and Brinkam, 2012). According to Eme et al. (2014), the primary cause of food insecurity in developing countries is the inability of people to gain access to food due to widespread poverty and unemployment. This also inhibits purchasing power and prevents assured access to food supplies.
However, the problem of food insecurity, especially during the hungry period among rural households in Nigeria, is long standing (Obamiro et al., 2005). This is because after harvesting most rural households are food secure, as they have enough food from their own production. However, owing to inadequate processing and storage facilities, they usually end up selling their excess produce at low prices during the harvesting period. Most times, they rely on market purchases, since they do not have enough to subsist on the year round. This leads to inconsistent food availability, thus contributing to food insecurity during the period (Adepoju and Adejare, 2013). Achievement of food security in any country is typically an insu-rance against hunger and malnutrition, both of which hinder economic development (Davies, 2009).
Many of the available studies have analyzed and shown the welfare implications of food prices on urban households, with only few of them focused on rural and farming households. Such studies include Nguyen (2010) analyzed food expenditure patterns of the households in Vietnam, Campbell et al. (2010) for Bangladesh, Shimeles and Delelegn (2013) for Ethiopia. However, these studies are lacking in Nigeria. This study therefore fills the gap by focusing on the food expenditure effects on farming household welfare, income and expenditure pattern in Nigeria.
MATERIALS AND METHODS
Study area
Osun state was carved out of the Old Oyo State in 1991. It is located in the southwestern part of Nigeria, covers a land area of approximately 14,875 km2. In terms of location, Osun State lies between longitude 0400’E and 05 05’ and latitude 05 558” and 08 07” (NPC, 2006).
The mean annual rainfall varies from 231.75 cm in the southern part to 206 cm in Osun State, and highest rainfall is usually recorded in the months of July and August. Mean maximum ambient temperature values range between 33.84°C in February and 28.8°C in August, while mean minimum temperatures range between 25.18°C in March and 23.0°C in August. Higher temperatures are recorded at the peak of the dry season, between November and May, while lower temperatures are recorded in the rainy season. Relative humidity is usually in excess of 70%, especially during the peak of the wet season. Highest values of 78% occur in June to October and the lowest value of 57% was recorded in February.
Sampling technique
A three stage sampling technique was used to select the sample of house-holds for this study. In stage 1, 10 rural local government areas were randomly selected out of the 30 local government areas in Osun State. In stage 2, two villages were selected from each of the 10 local government areas and in stage three, 12 households were randomly selected from each of the villages, making a total of 240 questionnaires administered, but only 222 had adequate information fit for analysis.
The primary data used for this study was collected through the use of interview schedule method. Information was collected on the socio-economic characteristics of rural households, sources of livelihood available to households, household total monthly income, expenditure of rural households, household food intake data, household characteristics, data on food prices for two months were collected. Also, data were collected on all types of food consumed by households, foods consumed from their own farms or gardens, and foods received in kind.
Analytical technique
Descriptive statistics, which include frequency table and percentages, were used to analyse socioeconomic charac-teristics of the respondents, the proportion of households’ total income spent on food and non-food items.
The logistic regression model was used to analyze the determinants of food security among the households, as well as the effect of food expenditures on households’ welfare. It is commonly applied to dichotomous dependent variables (Heck, 2012). Food Insecurity Gap (FIG) and Squared Food Insecurity Gap (SFIG) were used to capture the severity of food security and insecurity status of the households, as used by Maharjan and Chhetri (2006). Food security status was calculated based on calorie requirement according to gender and age of household members, as recommended by FAO (2005).
Logistic regression model
To identify the determinants of households’ food consumption expendi-ture, the model is specified explicitly as:
Log Y= Log (α + β1X1 + β2X2 + β3X3 + β4X4 + β5X5 + β6X6 + β7X7 + β8X8 + e) (1),
where, Y = household monthly food expenditure; X1 = gender of household head (1, if male and 0, if female); X2 = access to credit; X3 = Years of schooling; X4 = distance to market; X5 = household size; X6 = monthly household income (naira); X7 = dependency ratio; X8 = age of household head (years); e = error term; α = constant; β = parameter coefficient to be estimated.
Measuring food security
To measure household food security, a food security index was constructed, this involves two steps: identification and aggregation. Identifica-tion is the process of defining a minimum level of nutrition necessary to maintain healthy living the “food security line” for the population under the study, below which households are classified as food-insecure. Aggregation, on the other hand, derived food security statistics for the households (Olayemi, 1998). Daily per capita calorie consumption was estimated by dividing the estimated daily calorie supply to the household by the household size adjusted for adult equivalence using the equivalent male adult scale weights, while household calorie availability was estimated using food nutrient composition. A daily recommended level of 2500 kcal per capita per day was adopted as the food security line for the study (FAO, 2005). In line with this, any household whose per calorie intake is found to be equal or greater than their demands was regarded as food secured, while household experiencing a deficit was regarded as food insecured.
To assess the effect of food expenditure on households’ food security status, the logistic model in its implicit form is stated as:
Y= ƒ(X1,X2,X3,X4,X5,X6,X7,X8 …U) (2),
where, Y (dependent variable) = food security indicator (FSI) of farming households.
The food security indicator (FSI) was measured in such a way that a food secured household takes the value of 1, while food insecure household takes 0.
X1 = gender of household head (male = 1, female = 0); X2 = age of household head (years); X3 = year of schooling; X4 = adjusted household size; X5 = dependency ratio; X6 = farm experi-ence; X7 = food expenditures (naira); X8 = access to credit (1= yes, 0 otherwise); U = disturbance term.
RESULTS AND DISCUSSION
Sample characteristics
Table 1 revealed that about 98% of sampled farming household head were male headed and 2% were female headed. Their average age was 57 years and 90.4% of the respon-dents were above 40 years of age. The marital status indicates 91% of the sampled respondents were married. The educational level of the respondents also indicates that 4.5% of them were non-formal, while about 95.5% had formal education ranging from primary to university degree.
About 46% of the respondents had trading as their secondary occupation, 16.7% fishing and 20.7% craft and artisan among others. The modal household size of the respondent is between 3 and 4 persons, which is about 48%, while only 9% of the respondents have household size of more than 5 in adult male equivalent.
About 83% of the respondents have not more than one dependent, while 6.3% of the respondents have at least three dependents. 52.7% of the respondents have land size of less than 3 ha, with at least 93% of the respondent spends more than ₦10,000 monthly on food to augment own production ($1= ₦360.7).
Majority of the respondent (30.6%) have asset base less than ₦10,000 monetary value. For the welfare characteristics of households, 24.3% of the respondents are food insecure, while about 87% of them can be categorized as non-poor using the recommended security line of 2,500 Kcal/AE/day (FAO, 2005).
Analysis of the basic food items consumed by farming households
Table 2 shows that all household in the study area consume rice, beans, vegetable, fish and oil, as basic food items, while only 32% of them consume potatoes in the study area.
Analysis of households’ monthly expenditure on the different food items showed that farmers in the study area spend the larger proportion of their monthly food expense on meat, rice and vegetables.
This may be attributed to the fact that majority of the farmers in the study area do not plant vegetables and only very few keep livestock for consumption.
On the other hand, households in the study area spend the lesser proportion of their monthly food expenses on potatoes, fruits and maize. This may be attributed to the fact that majority of the farmers cultivate maize and potatoes in the study area.
Analysis of household welfare indices disaggregated by per capita income
Table 3 shows the average values of household welfare indices disaggregated by household income. It can be deduced from the table that low income household (₦3,289.50-₦10,885) was characterized by low monthly food expense, low daily per capita calorie intake, low monthly per capita expenditure.
This may be attributed to the low household asset base, small farm size, large household size and number of dependents in the household. However, reverse is the case for a high income household.
Table 1
Distribution of farmers by their socio-economic and welfare characteristics
| Socio-economic characteristics | Frequency | Percentage |
| Gender | ||
| Male | 217 | 97.7 |
| Female | 5 | 2.3 |
| Age (years) | ||
| <30 | 0 | 0 |
| 31-40 | 22 | 9.9 |
| 41-50 | 71 | 32.0 |
| 51-60 | 79 | 35.9 |
| >60 | 50 | 22.5 |
| Educated level | ||
| Primary | 76 | 34.2 |
| SSCE/GCE | 58 | 26.1 |
| NCE/ND | 30 | 13.5 |
| HND | 22 | 9.9 |
| University | 26 | 11.8 |
| No formal education | 10 | 4.5 |
| Farming experience (years) | ||
| 1-10 | 50 | 22.5 |
| 11-20 | 95 | 39.7 |
| 21-30 | 63 | 25.7 |
| >30 | 50 | 22.5 |
| Marital status | ||
| Married | 202 | 91.0 |
| Divorced | 4 | 1.8 |
| Widowed | 16 | 7.2 |
| Household size (adult equivalent) | ||
| 2.1-3 | 58 | 26.1 |
| 3.1-4 | 106 | 47.7 |
| 4.1-5 | 30 | 13.5 |
| >5 | 20 | 9.0 |
| Dependency ratio | ||
| <0.5 | 122 | 55.0 |
| 0.6-1 | 62 | 27.9 |
| 1.1-1.5 | 22 | 9.9 |
| 1.6-2 | 2 | 0.9 |
| >2 | 14 | 6.3 |
| Secondary occupation (household head) | ||
| Trading | 101 | 45.5 |
| Fishing | 37 | 16.7 |
| Private | 28 | 12.6 |
| Craft and artisan | 46 | 20.7 |
| Others | 10 | 4.5 |
| Land size (ha) | ||
| <1 | 22 | 9.9 |
| 1-3 | 117 | 52.7 |
| 3-7 | 76 | 34.2 |
| 8-10 | 7 | 3.2 |
| Total asset (naira) | ||
| <100000 | 68 | 30.6 |
| 100001-200000 | 34 | 15.3 |
| 200001-300000 | 18 | 8.1 |
| 300001-400000 | 20 | 9.0 |
| 400001-500000 | 20 | 9.0 |
| >500000 | 62 | 27.9 |
| Food expenditure (naira) | ||
| 5000-10000 | 15 | 6.8 |
| 10001-15000 | 106 | 47.7 |
| 15001-20000 | 56 | 25.2 |
| 20001-25000 | 30 | 13.5 |
| 25001-30000 | 12 | 5.4 |
| 30001-35000 | 3 | 1.4 |
| Food security status | ||
| Food insecure | 54 | 24.3 |
| Food secure | 168 | 75.7 |
Source: Field survey, 2014.
Table 2
Distribution of the basic food items consume by farming households
| Food item | No. of household that consume |
Average price per unit (naira) |
Average amount spent per month (naira) |
| Garri | 220(99.1%) | 143.60 | 795.86 |
| Maize | 182(82%) | 97.66 | 339.37 |
| Rice | 222(100%) | 342.88 | 2,171.63 |
| Bread | 194(87.4%) | 131.08 | 644.68 |
| Beans | 222(100%) | 341.26 | 1,336.94 |
| Yam | 202(91%) | 458.11 | 1,136.96 |
| Vegetable | 222(100%) | 482.25 | 1,932.43 |
| Fruit | 206(92.8%) | 53.15 | 259.91 |
| Meat | 216(97.3%) | 683.78 | 2,429.73 |
| Fish | 222(100%) | 254.05 | 1,576.58 |
| Oil | 222(100%) | 496.94 | 1,162.61 |
| Cassava | 108(48.6%) | 245.95 | 805.45 |
| Potatoes | 72(32.4%) | 18.03 | 110.36 |
| Other foods | 222(100%) | 499.55 | 1,458.15 |
Source: Field survey, 2014; Figures in the bracket represent the proportion of households that consume the food item.
Table 3
Summary of household welfare indices disaggregated by per capita income
| Index | Low income class | Middle income class | High income class |
| Per capita income (N) | 7,515 | 14674.79 | 25,032.05 |
| (2108.66) | (1676.90) | (6495.83) | |
| Total asset (N) | 654,000 | 962,000 | 982000 |
| (607425.24) | (1251539.88) | (1154062.97) | |
| Food expense (N) | 16,300 | 16,600 | 16,700 |
| (5294.91) | (5392.74) | (5764.14) | |
| Per capita expenditure (N) | 7,969.20 | 9,805.83 | 14,168.71 |
| (2,594.00) | (3,161.45) | (4,501.67) | |
| Household size (AE) | 3.94 | 3.83 | 3.33 |
| (0.94) | (1.01) | (1.08) | |
| Farm size (Ha) | 2.54 | 3.64 | 3.07 |
| (1.96) | (1.96) | (1.99) | |
| Dependency ratio | 0.76 | 0.52 | 0.69 |
| (0.65) | (0.48) | (0.56) | |
| Per capita calorie | 2,861.50 | 3,137.22 | 4,089.10 |
| (1137.39) | (807.20) | (4963.78) |
Source: Field survey, 2014; Figures in parenthesis are the standard deviations.
Factors determining households’ food expenditure
The regression result in Table 4 shows that the household size, per capita income, dependency ratio and age were highly significant factors influencing the food expenditure in the study area. They were all positi-vely significant at 1% and 10%. The coefficient of household size (adult equivalent) is significant at 1% level and positively related indicating that the higher the household size, the higher the expenditure on food. The coefficient of per capita income was also positively significant at 1%, this means the more the number of people depending on the household head the more his expenditure on food, other things being equal. Finally, it was also discovered that as the age of house-hold head increases, the household’s expenditure on food also increases. This can be attributed to the fact that, as the household head gets older, his choice of food changes which can result in additional expenses.
Effect of food expenditure on food security status
The logistic regression result in Table 5 shows the effect of food expenditure on the food security status of households in the study area. Food expenditure was positively significant at 5%, this means that as food expenditure increases, there was higher probability that the household will be food secured. Therefore, it can be seen that food expenditure affects food security of the farming house-hold. It also shows that the household size and experience in farming were highly significant at 1%. The house-hold size (adult equivalent) was negatively significant indicating that the higher the household size, the lower the likelihood of the household being food secured. The coefficient of farming experience was positively significant at 1%. This also means the more experienced the household is in farming, the higher the likelihood of being food secured.
Table 4
Cobb-Douglass estimates of the determinants of food expenditure
| Variable | Coefficient | Standard error | t-statistics |
| Constant | 2.624*** | 0.263 | 9.973 |
| Gender | -0.065 | 0.052 | –1.260 |
| Access to credit | 0.012 | 0.017 | 0.747 |
| Years of schooling | 0.002 | 0.005 | 0.435 |
| Market distance | 0.003 | 0.003 | 0.756 |
| Household size (AE) | 0.557*** | 0.073 | 7.591 |
| Per capita income | 0.150*** | 0.036 | 4.200 |
| Dependency ratio | 0.039* | 0.014 | 2.803 |
| Age | 0.386*** | 0.100 | 3.867 |
| Adjusted R2 | 0.327 | ||
| F-sat | 14.438*** |
Source: Field survey, 2014; *,**, *** indicate the coefficients are statistically significant at 10%, 5% and 1%, respectively.
Table 5
Factors affecting food security status of farming households
| Variables | Coefficient | Standard | Z-value |
| Constant | -15.2665 | 7.8365 | -1.95 |
| Gender | -0.3703 | 1.2549 | -0.30 |
| Age | -1.1654 | 2.8783 | -0.40 |
| Year of schooling | 0.1420 | 0.1088 | 1.30 |
| Household size (AE) | -13.0146*** | 2.4252 | -5.37 |
| Dependency ratio | -0.0484 | 0.0968 | -0.05 |
| Farm experience | 5.9263*** | 1.8178 | 3.26 |
| Food expenditure | 5.389** | 2.321 | 2.28 |
| Access to credit | 0.2643 | 0.3811 | 0.69 |
Source: Field survey, 2014; * , **, *** indicate the coefficients are statistically significant at 10%, 5% and 1% level, respectively.
Coping strategies adopted by households
As shown in Fig. 1, the coping strategy that is mostly adopted by the farmers in the study area is strategy 1, which is to cut down the numbers of food items consumed. So, as to cope with their shortage in income, the farmers tend to reduce the number of food items they purchase. This is followed by strategy 12 (consumption of less expensive food). Aside cutting down the quantity, they also watch the price of goods they go for. Thus, they tend to purchase food items of lower prices, which can also mean lower quality. Also, their carbohydrate intake will also increase, since other classes of food items tend to be more expensive than that of carbohydrate. So, in light of going for a cheaper set of food items, they purchase more of carbohydrate. The least adopted strategy is strategy 13 (skip a whole day without eating).
Strategy 1: Cut down on the number of food items consumed; Strategy 2: Increase the intake of carbohydrate; Strategy 3: Reduce no of meals per day; Strategy 4: Reduce quantity of meals consumed; Strategy 5: Buy food on credit; Strategy 6: Reduce quantity of meals served to children; Strategy 7: Reduce quantity of meals served to women; Strategy 8: Reduce quantity of meals served to men; Strategy 9: Family and friends; Strategy 10: Borrow food stuffs; Strategy 11: Borrow money to buy food stuffs; Strategy 12: Consumption of less expensive food; Strategy 13: Skip a whole day without eating; Strategy 14: Others.
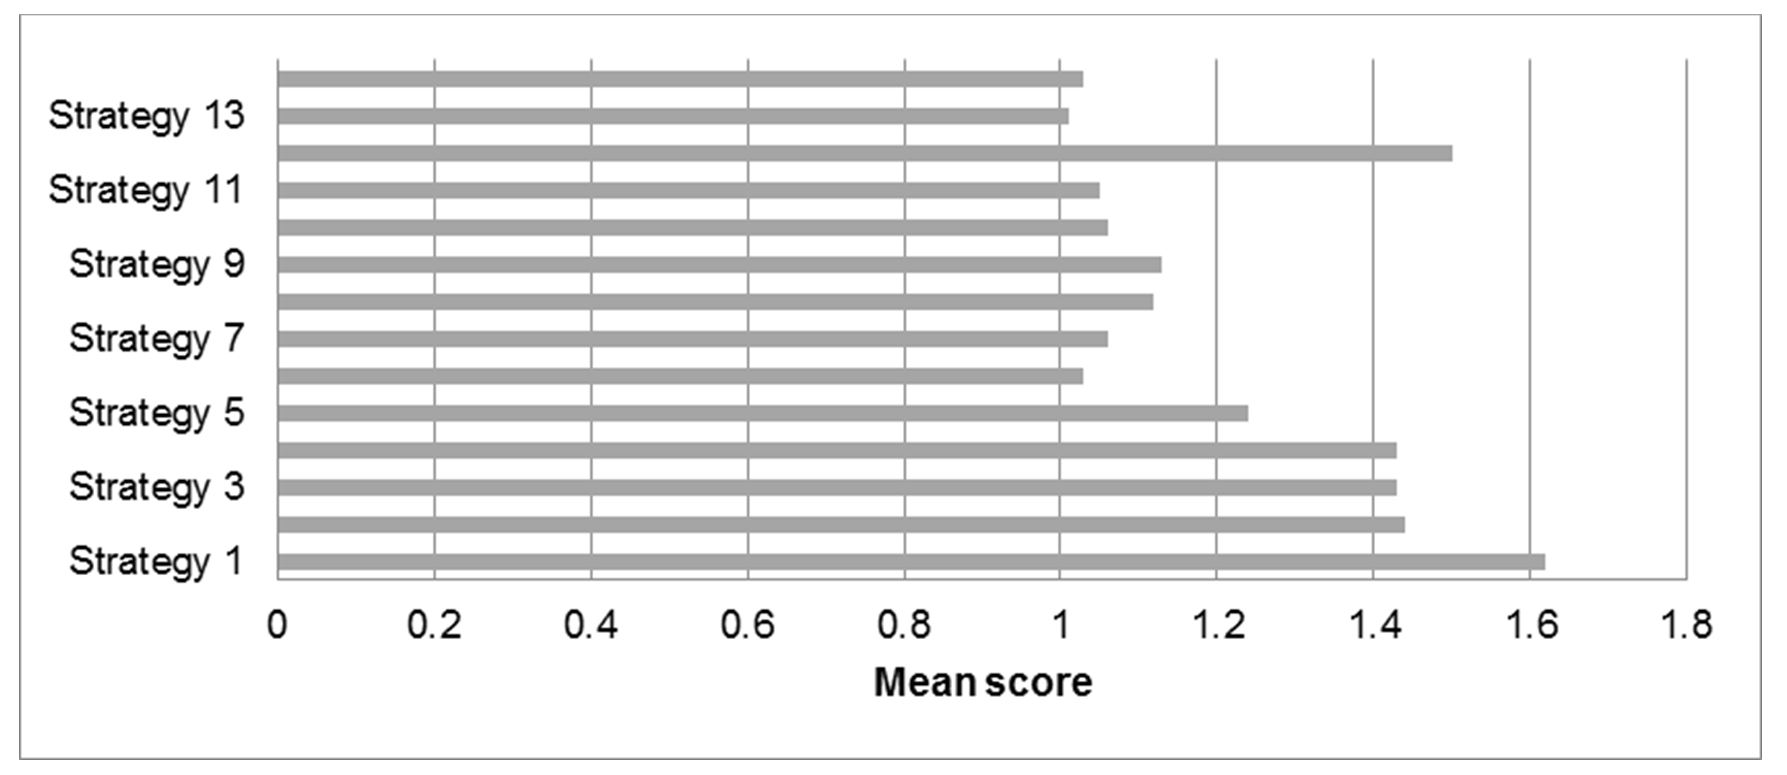
Figure 1- Bar chart showing coping strategies adopted by households (Source: Field survey, 2014)
CONCLUSION
Food security analysis showed that 76% of the households were food secured, while 24% were food insecure. It was also observed that households that expend more on food has higher income and therefore tend to be more food secure. Also, it was discovered that household food security decreases with increasing household size. Higher prices of the food commodities not produced by the farmers increase their food expenditure, which in turn affects their food security status, except for those who took measures to cushion the effect. Based on the findings, it was recommended that more rural financial and agricultural extension services are needed; these will improve the conditions needed for increased productivity and capital accumulation. Also, promoting agricultural policies with appropriate price incentives that focus on intensification; diversification and resource-stabilizing innovations will create more wealth for all categories of farming households. This in turn will ensure food security, especially in an era of economic deregulation, such as that in the present Nigeria.
REFERENCES
Adepoju, A.O. & Adejare, K.A. (2013). Food insecurity status of rural households during the post-planting season in Nigeria. Journal of Agriculture and Sustainability, 4(1): 16-35.
Akanbiemu, F.A., Fatiregun, A.A. & Adejugbagbe, A.M. (2016). Determinants of household food insecurity in rural and urban districts of a southwest state, Nigeria, Asian Journal of Agricultural Extension, Economics & Sociology, 13(3): 1-11, DOI: 10.9734/AJAEES /2016/29716
Akinyele, I.O. (2009). Ensuring food and nutrition security in rural Nigeria: an assessment of the challenges, information needs, and analytical capacity. Nigeria Strategy Support Program, Background Paper No. NSSP 007, IFPRI, www.ifpri.org.
Benson, T. (2004). Africa’s: food and nutrition security situation where are we and how did we get here? 2020 Discussion Paper 37, IFPRI, www.ifpri.org.
Campbell, A.A. et al. (2010). Household rice expenditure and maternal and child nutritional status in Ban-gladesh. The Journal of Nutrition, 140(1): 189-194, DOI: 10.3945/jn. 109.110718
Davies, A.E. (2009). Food security initiatives in Nigeria: prospects and challenges, Journal of Sustainable Development in Africa, 11(1): 186-202.
Eme, O.I., Onyishi, T., Uche, O.A. & Ijeoma, B. (2014). Challenges of food security in Nigeria: options before government. Arabian Journal of Business and Management Review (OMAN Chapter), 4(1): 11-25.
FEWSNET (2014). Nigeria Report www.fews.net/sites/default/files/documents/report/Nigeria
Food and Agriculture Organization of the United Nations/World Health Organization (FAO/WHO) (1992). Proceedings of the International Conference of Nutrition, Dec. 9-12, Rome.
Food and Agricultural Organization (FAO) (1996). Rome Declaration on World Food Security and World Food Summit Plan of Action. World Food Summit, 13-17 Nov. 1996, Rome.
Food and Agricultural Organization (2005). Production Year Book. FAO Rome, Italy.
Heck, R. (2012). Introduction to genera-lized linear models: logistic regression. Multilevel Regression Models and Their Applications, Seminars, Portland State University.
Hendrix, C. & Brinkman, H. (2012). Food insecurity and conflict dynamics – causal linkages and complex feedbacks. Food Insecurity in Protracted Crises, High-Level Expert Forum, Rome, 13-14 Sept. 2012.
Maharjan, K.L. & Khatri-Chhetri, A. (2006). Household food security in rural areas of Nepal: Relationship between socio-economic charac-teristics and food security status, Gold Coast, Australia: Poster paper prepared for presentation at the International Association of Agricultural Economics Conference.
Nguyen, M.C. (2010). Three essays in development economics: the case of Vietnam. Ph.D. dissertation, the American University, AAT 3406837.
NPC (2006). Population and Housing Census of the Federal Republic of Nigeria 2006 Census. Abuja: National Population Commission.
Obamiro, E. & Kormawa, P. (2003). Pillars of food security in rural areas of Nigeria. Food Africa, Internet Forum 31 Mar.- 1Apr. Interne paper accepted for the Food Security. Available online http://foodafrica.nri. org/security/internetpapers/ObamiroEunice.pdf
Olayemi, J.K. (1998). The Nigerian food equation towards a dynamic equilibrium. Inaugural Lecture. No 167, University of Ibadan, Nigeria.
Shimeles, A. & Delelegn, A. (2013). Rising food prices and household welfare in Ethiopia: evidence from Micro Data. Working Paper Series, No. 182.
Tollens, F. (2000). Food security: incidence and causes of food insecurity among vulnerable groups and coping strategies. In CTA (2000) Food Insecurity in ACP Countries, Proceedings of a CTA Seminar, pp. 27-50.
Adekunle A.O., Babatunde R.O., Omoniwa A.E., Oyeleke G.T.

© by the authors; licensee Journal of Applied Life Sciences and Environment, Iasi, Romania. This article is an open access article distributed under the terms and conditions of the Creative Commons Attribution License (http://creativecommons.org/licenses/by/4.0)
