N.D. Amarasingha, J.A.P. Bodhika, W.G.D. Dharmaratna, L.P. Jayatissa
ABSTRACT. Grass has a high leaf density and requires minimum space to grow. This experiment was designed to determine the sound absorption behaviour of six grass species (Zoysia matrella (L) Merr., Stenotaphrum dimidiatum(L.) Brongn, Panicum repens (L.), Eleusine indica (L.) Gaertn., Axonopus compressus (Sw) P. Beauv, and Ischaemum sp.) for their possible use as noise screens. The sound absorption of each morphological leaf structure was studied. For Sound Absorption Coefficients (SAC) (α) studies, the reverberation room method under ISO 345:2003 standards was followed. A B&K dodecahedron Omni-directional speaker, power amplifier, and 2250L handheld analyser were used for reverberation time and RT60 measurements. Microscopic images of grass leaves were analysed using ImageJ software. This study revealed that grasses with the highest and lowest SAC for higher noise frequencies (> 1500 Hz) are S. dimidiatum Brongn and A. compressus, respectively. The SAC of S. dimidiatum Brongn positively correlated with noise frequency. In general, the correlation of SAC (α) with noise frequency (f) is in the form of log10α = a1log10f + b1 where a1 and b1 are grass type-dependent constants. The morphological parameters like total leaf area, total sample area, plant height, and sample dry weight strongly correlated with the SAC. But leaf thickness, length, width, surface area, and the weight of the sample poorly correlated with SAC in the frequency range.
Keywords: Grass; Sound Absorption Coefficient; Morphological Characteristics; Correlations.
Cite
ALSE and ACS Style
Amarasingha, N.D.; Bodhika, J.A.P.; Dharmaratna, W.G.D.; Jayatissa, L.P. An investigation of the noise absorption potential of a six selected grass species. Journal of Applied Life Sciences and Environment 2021, 54(4), 429-438.
https://doi.org/10.46909/journalalse-2021-037
AMA Style
Amarasingha ND, Bodhika JAP, Dharmaratna WGD, Jayatissa LP. An investigation of the noise absorption potential of a six selected grass species. Journal of Applied Life Sciences and Environment. 2021; 54(4): 429-438.
https://doi.org/10.46909/journalalse-2021-037
Chicago/Turabian Style
Amarasingha, N.D., J.A.P. Bodhika, W.G.D. Dharmaratna, and L.P. Jayatissa. 2021. “An investigation of the noise absorption potential of a six selected grass species” Journal of Applied Life Sciences and Environment 54, no. 4: 429-438.
https://doi.org/10.46909/journalalse-2021-037
View full article (HTML)
An Investigation of the Noise Absorption Potential of a Six Selected Grass Species
N.D. Amarasingha1*, J.A.P. Bodhika1, W.G.D. Dharmaratna1, L.P. Jayatissa1
1University of Ruhuna, Sri Lanka
*E-mail: nalinamarasingha900301@gmail.com
Received: June 20, 2022. Revised: July 04, 2022. Accepted: July 13, 2022. Published online: July 25, 2022
ABSTRACT. Grass has a high leaf density and requires minimum space to grow. This experiment was designed to determine the sound absorption behaviour of six grass species (Zoysia matrella (L) Merr., Stenotaphrum dimidiatum(L.) Brongn, Panicum repens (L.), Eleusine indica (L.) Gaertn., Axonopus compressus (Sw) P. Beauv, and Ischaemum sp.) for their possible use as noise screens. The sound absorption of each morphological leaf structure was studied. For Sound Absorption Coefficients (SAC) (α) studies, the reverberation room method under ISO 345:2003 standards was followed. A B&K dodecahedron Omni-directional speaker, power amplifier, and 2250L handheld analyser were used for reverberation time and RT60 measurements. Microscopic images of grass leaves were analysed using ImageJ software. This study revealed that grasses with the highest and lowest SAC for higher noise frequencies (> 1500 Hz) are S. dimidiatum Brongn and A. compressus, respectively. The SAC of S. dimidiatum Brongn positively correlated with noise frequency. In general, the correlation of SAC (α) with noise frequency (f) is in the form of log10α = a1log10f + b1 where a1 and b1 are grass type-dependent constants. The morphological parameters like total leaf area, total sample area, plant height, and sample dry weight strongly correlated with the SAC. But leaf thickness, length, width, surface area, and the weight of the sample poorly correlated with SAC in the frequency range.
Keywords: Grass; Sound Absorption Coefficient; Morphological Characteristics; Correlations.
INTRODUCTION
Environmental noise pollution threatens the health (Berglund et al., 1995; Fong and Johnston, 2000) and well-being of humans and other living beings. Noise levels can be reduced through dampening (Sagartzazua et al., 2007). Noise barriers and absorption materials are often used to attenuate acoustic energy.
Sound barriers work through mechanisms of reflection, scattering, and absorption (Dobson and Ryan, 2000). They convert acoustic energy to heat due to the medium’s friction or viscosity. Absorption depends on the properties of the medium and the frequency of the sound waves.
In literature, many studies have investigated the ability of plants to absorb sound energy through different ways. In 1981, Martens and Michelsen conducted an experiment using four plant species (Ligustrum Hegelianism, Betula Verrucosa, Corylus Evelina). Another experiment was done by Horoshenkov et al. (2013) using the equivalent fluid model for sound propagation in porous media in the frequency range of 50–1200 Hz. In 1977 S. Yamada (Watanabe and Yamada, 1996) proposed a theoretical model to calculate the sound energy absorption of leaves. In 2010, Wong et al. proved that vertical greenery systems could absorb sound energy and reduce sound levels. Kang et al. (2013) conducted a series of measurements to examine the sound absorption coefficients of vegetation and bedding plants using a reverberation room method (Smyrnova et al., 2010).
This study investigates the sound absorptive characteristics of six grass species (Figure 1) commonly available in Sri Lanka for their potential application as noise barriers. Some of these species are used for landscaping worldwide.
MATERIALS AND METHODS
Sound absorption coefficient (SAC)
The average sound absorptive coefficient (α) in an enclosure with different sound-absorbent materials is defined as
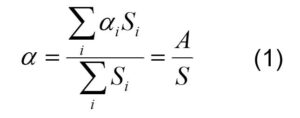
where A represents the total effective absorptive area, and S is the total spatial area. αi and Si are the relevant values for different absorbent materials in the enclosure.
W.C. Sabine, in the late 1890s, derived a relationship to calculate RT60 in terms of room volume (V) and total effective absorption area (A), which is given in equation (2) (Hughes et al., 2015).

If the RT60 values for an enclosure without a sample are T1 and T2, equations (1) and (2) can be extended to calculate the sample average SAC.
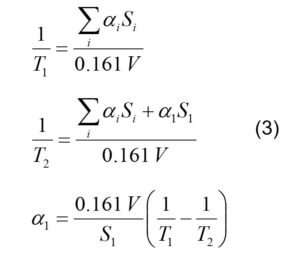
In this study, equation (3) was used to calculate the sound absorption coefficient of grass species by measuring the reverberation time where S1 is the total sample area.
Six grass species, Zoysia matrella(L) Merr., Stenotaphrum dimidiatum(L.) Brongn, Panicum repens(L.), Eleusine indica(L.) Gaertn., Axonopus compressus (Sw) P. Beauv, and Ischaemum sp. were selected for the study.
The primary considerations in selecting these plants were their acoustic interactions, availability, high potential growth under tropical climates, and manageability in challenging environments. Naturally grown plants collected from the field were used for the experiment (Fig. 2a). Herbarium specimens were prepared from the National Herbarium, Peradeniya, Sri Lanka, for identification purposes.
The reverberation room method (Asdrubali et al., 2014; Hughes et al., 2015; Smyrnova et al., 2010; ISO 345:2003) is described under ISO 345 standards (ISO 345:2003) and is widely accepted for testing large samples and calculating random incidence absorption coefficients (Prisutova et al., 2014) (Fig. 2b). Per the standards, the minimum recommended volume of the standardised reverberation room, 200 m3, and the surface area of the test specimen between 10 m2 and 12 m2 were utilised. The testing room used in this study was cuboidal shaped with an approximate volume of 60 m3 and a total internal surface area of 102 m2 covered by four brick walls. The total diffuser area and the room length were 16 m2 and 7.1 m, respectively (Rasa, 2016; del Rey et al., 2017). The relative surface area of the reverberation room, the diffuser area ratio to the total interior room area, is 0.157 and follows the given standards. All the sample areas of the tested specimens were between 3.1-3.6 m2 and agreed with the standards.

Figure 1 – (a) Z. matrella.(b)S. dimidiatum(L)Brongn. (c) P. repens, (d) E. indica (L) Gaertn., (e) A. compressus (Sw) P. Beauv (f). Ischaemum sp.
Each species’ healthy and densely grown naturally grasses were used to prepare the testing samples. The grasses selected from the monoculture were uprooted with minimal damage and transported immediately in sealed bags to the laboratory. Then root soil was carefully washed away, and the grasses devoid of extra moisture were placed within a 1.4 × 1.4 m2 area to be used as the testing sample. Three samples from each of the six species grown in three different environments were used for the experiment.
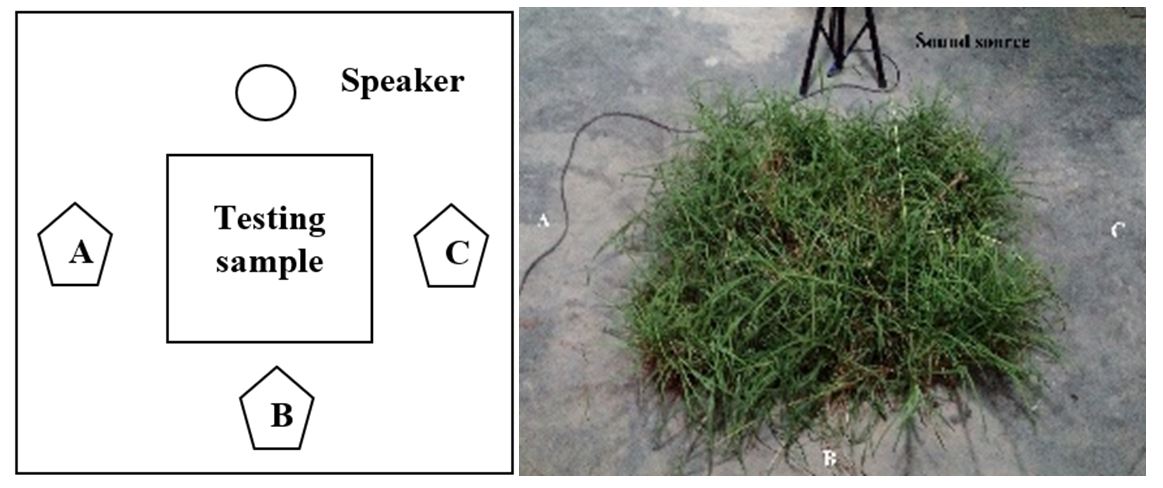
Figure 2 – (a) The experimental setup speaker and sound analyser locations A, B and C; (b) Testing sample in the centre of the reverberation room.
A type 2250L B&K handheld sound analyser with reverberation time software (BZ 7227), Dodecahedron Omni Directional B&K speaker (makes 360 degrees sound), an internal sound generator with a B&K Power amplifier, and a 16 Megapixel camera were the primary equipment used in the study. The testing sample was placed in the middle of the reverberation room. The handheld analyser was fixed on a tripod and set 1 m away from the plant samples and 1 m from the ground to reduce the effects. The reverberation room temperature and humidity were monitored using a Kestrel 4500 pocket weather tracker. Readings showed that weather conditions were not significantly different and unlikely to affect the experiments. A Dodecahedron Omni Directional speaker was positioned 1 m away from the sample.
Pink noise (Wong et al., 2010), which contained an equal energy output for all octave bands between 800 Hz-3150 Hz, was generated by the power amplifier used in the experiment. Corresponding RT30 values for 1/3 octaves of the input frequency range were monitored for 1 min using the sound analyser with the reverberation time software (BZ 7227). Measurements were repeated for three analyser locations, A, B, and C, as illustrated in Fig. 2. Each measurement was repeated ten times. The standard reverberation time RT60 needed to determine SAC was calculated by multiplying the RT30 by two (del Rey et al., 2017). By repeating the procedure, T1 and T2 were obtained without and with the fresh samples, respectively. The total leaf area S1 of the sample was estimated by using Image-J software. From a birds-eye view, images of the adaxial surface of three portions of the 10 × 10 cm2 area of the sample (Fig. 3) were examined, and the average value was taken.
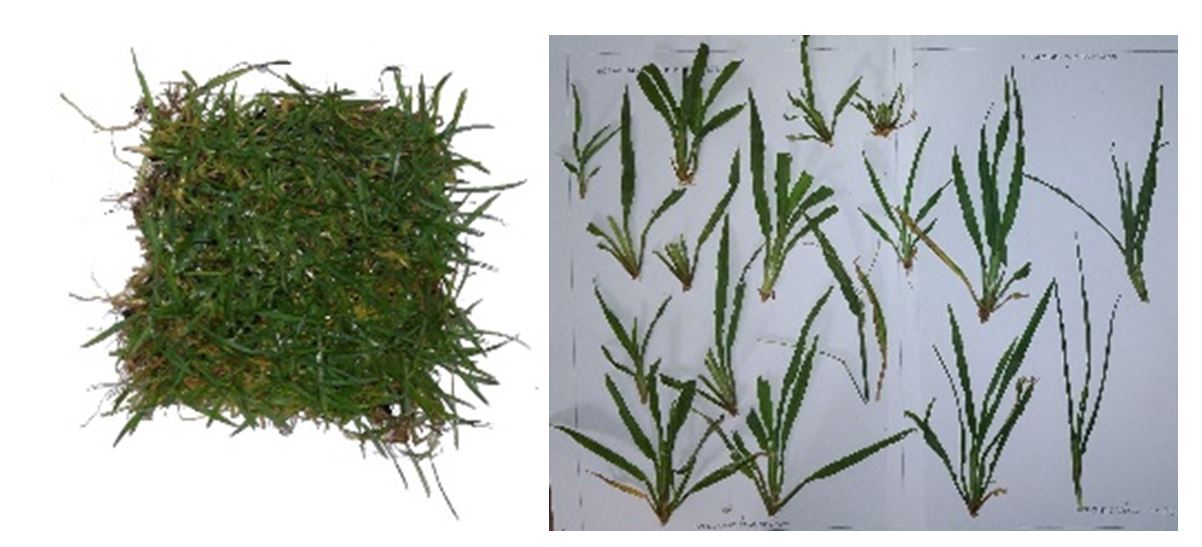
Figure 3 – A portion of a sample (10 × 10 cm2) and the leaves glued on paper to calculate the leaf area of the sample
Morphological characteristics such as the thickness of a leaf and nature (length of epidermal hairs) were examined at the microscopic level using a light microscope at high power (10 × 40). Fig. 4 illustrates the sample images taken by the camera. The adaxial area of a leaf sample area and total leaf area were obtained by analysing camera images. The sample area (the sample’s upper surface area) was calculated using a birds-eye view image of the sample. The total leaf area of the sample was measured manually by considering both sides of the leaf. A meter ruler and a vernier calliper were used for measuring the plant height, width, and leaf length of samples. The net and dry weights of the sample were measured using an electronic scale. SPSS software was used for all statistical analyses. The non-linear regression method was used to find the best correlations between SAC and frequency. R squared values and the significant values (p-values) were obtained for regression models to choose the best model.

Figure 4 – Microscopic images of the leaves. (a) Z. matrella, (b)S. dimidiatum(L)Brongn, (c) P. repens, (d) E. indica (L) Gaertn., (e) A. compressus (Sw) P. Beauv, (f). Ischaemum sp.
RESULTS AND DISCUSSION
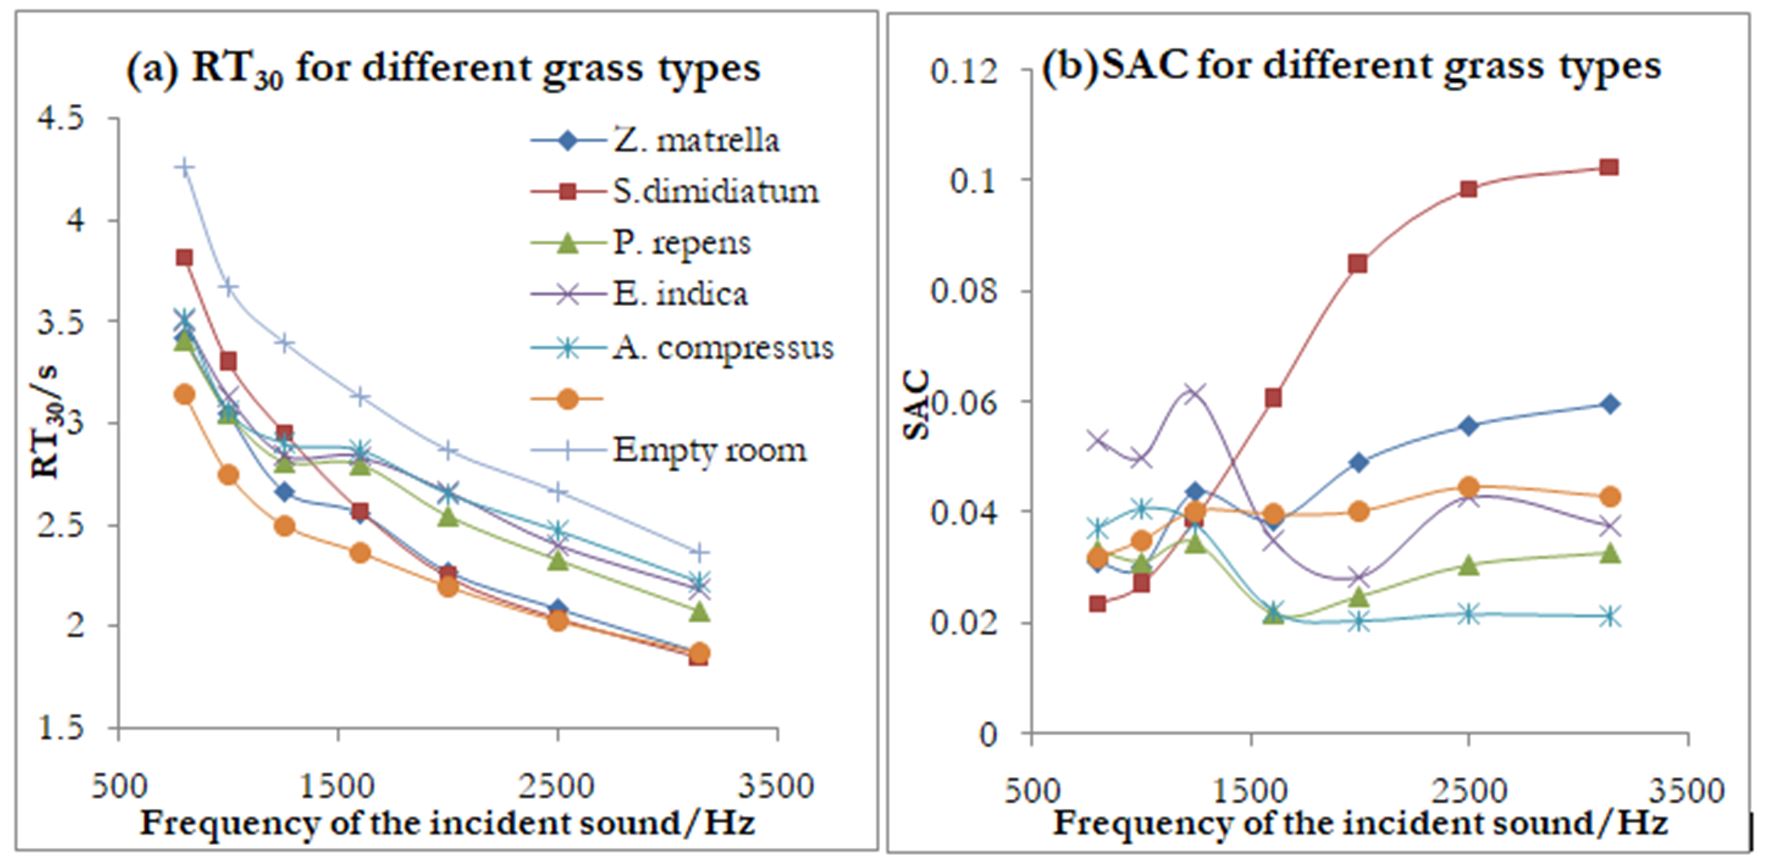
Ninety measurements were used for each plant sample. SAC were calculated using equation (03). The changes in RT30 and SAC with each selected grass species frequency is shown in Fig. 5(a) and 5(b), respectively.
For lower frequencies (< 1600 Hz), random variations of reverberation time and SAC could be observed, implying that noise absorption behaviour was not uniform at lower frequencies for these grass species. RT30 decreased sharply with increasing frequencies up to 1.5 kHz, and then it decreased gradually. The SAC was highest in S. dimidiatum for frequencies above 1500 Hz. However, it was the lowest in frequencies less than 1 kHz. A. compresus was the lowest sound absorptive grass species for noise frequencies higher than 1500 Hz. Ischaemum sp. had the lowest RT30 values over the frequency range. The difference in RT30 between Ischaemum sp. decreases from 800 Hz to 2500 Hz. The highest and lowest differences are 1.12 s (800 Hz) and 0.50 s (2500 Hz).
Table 1
Averaged RT30 and SAC values of the six grass species with their standard deviations given in the brackets for the tested frequency range
|
Details |
Averaged RT30/s |
Averaged SAC |
|
Z. matrella |
2.56 (0.54) |
0.04 (0.001) |
|
S.dimidiatumBrongn |
2.68 (0.71) |
0.06 (0.001) |
|
P. repens |
2.72 (0.45) |
0.03 (0.001) |
|
E. indica |
2.80 (0.44) |
0.04 (0.001) |
|
A. compressus |
2.81 (0.42) |
0.03 (0.001) |
|
Ischaemum sp. |
2.41 (0.44) |
0.04 (0.001) |
The averaged RT30 and SAC values for the tested frequency range with their standard deviations for six grass species are shown in Table 1. A. compressus had the highest averaged RT30 values. The plants with the highest and lowest averaged SAC values were S. dimidiatum Brongn and A. compressus, respectively. The SAC of S. dimidiatum Brongn increased significantly with increasing frequencies from 1500 Hz to 3150 Hz. S. dimidiatum Brongn spreads uniformly over the soil surface and grows very compactly, minimising leaf height variation. These features could be responsible for the highly correlated absorption properties of noise frequencies. Z. matrella and P. repens show the same SAC behaviour with increased frequencies. The averaged RT30 value of all tested grass types was between 2.41 to 2.81, and the average SAC was between 0.03 and 0.06. In a study by J. Kang et al. (2013), the SAC of Buxes and Holly are in the range of 0-0.2 for a similar frequency range. A significant increase in SAC values are seen from 1600 Hz, according to a study by Yang, Kang, and Cheal (2013). This study showed a similar variation in S. dimidiatum Brongn, Z. matrella and P. repens.
The possible correlation between RT30 and frequencies was statistically tested, and the corresponding R squared values and p-values were obtained using regression analysis. Most of the fitted functions, except S. dimidiatum Brongn and Ischaemum sp., were natural logarithmic functions. To make a similar pattern for all plant types, the RT30 values for the two deviated plant types were also fitted for natural logarithmic functions. All the adjusted R squared values of each fitted curve were higher than 0.94, as shown in Fig. 6.
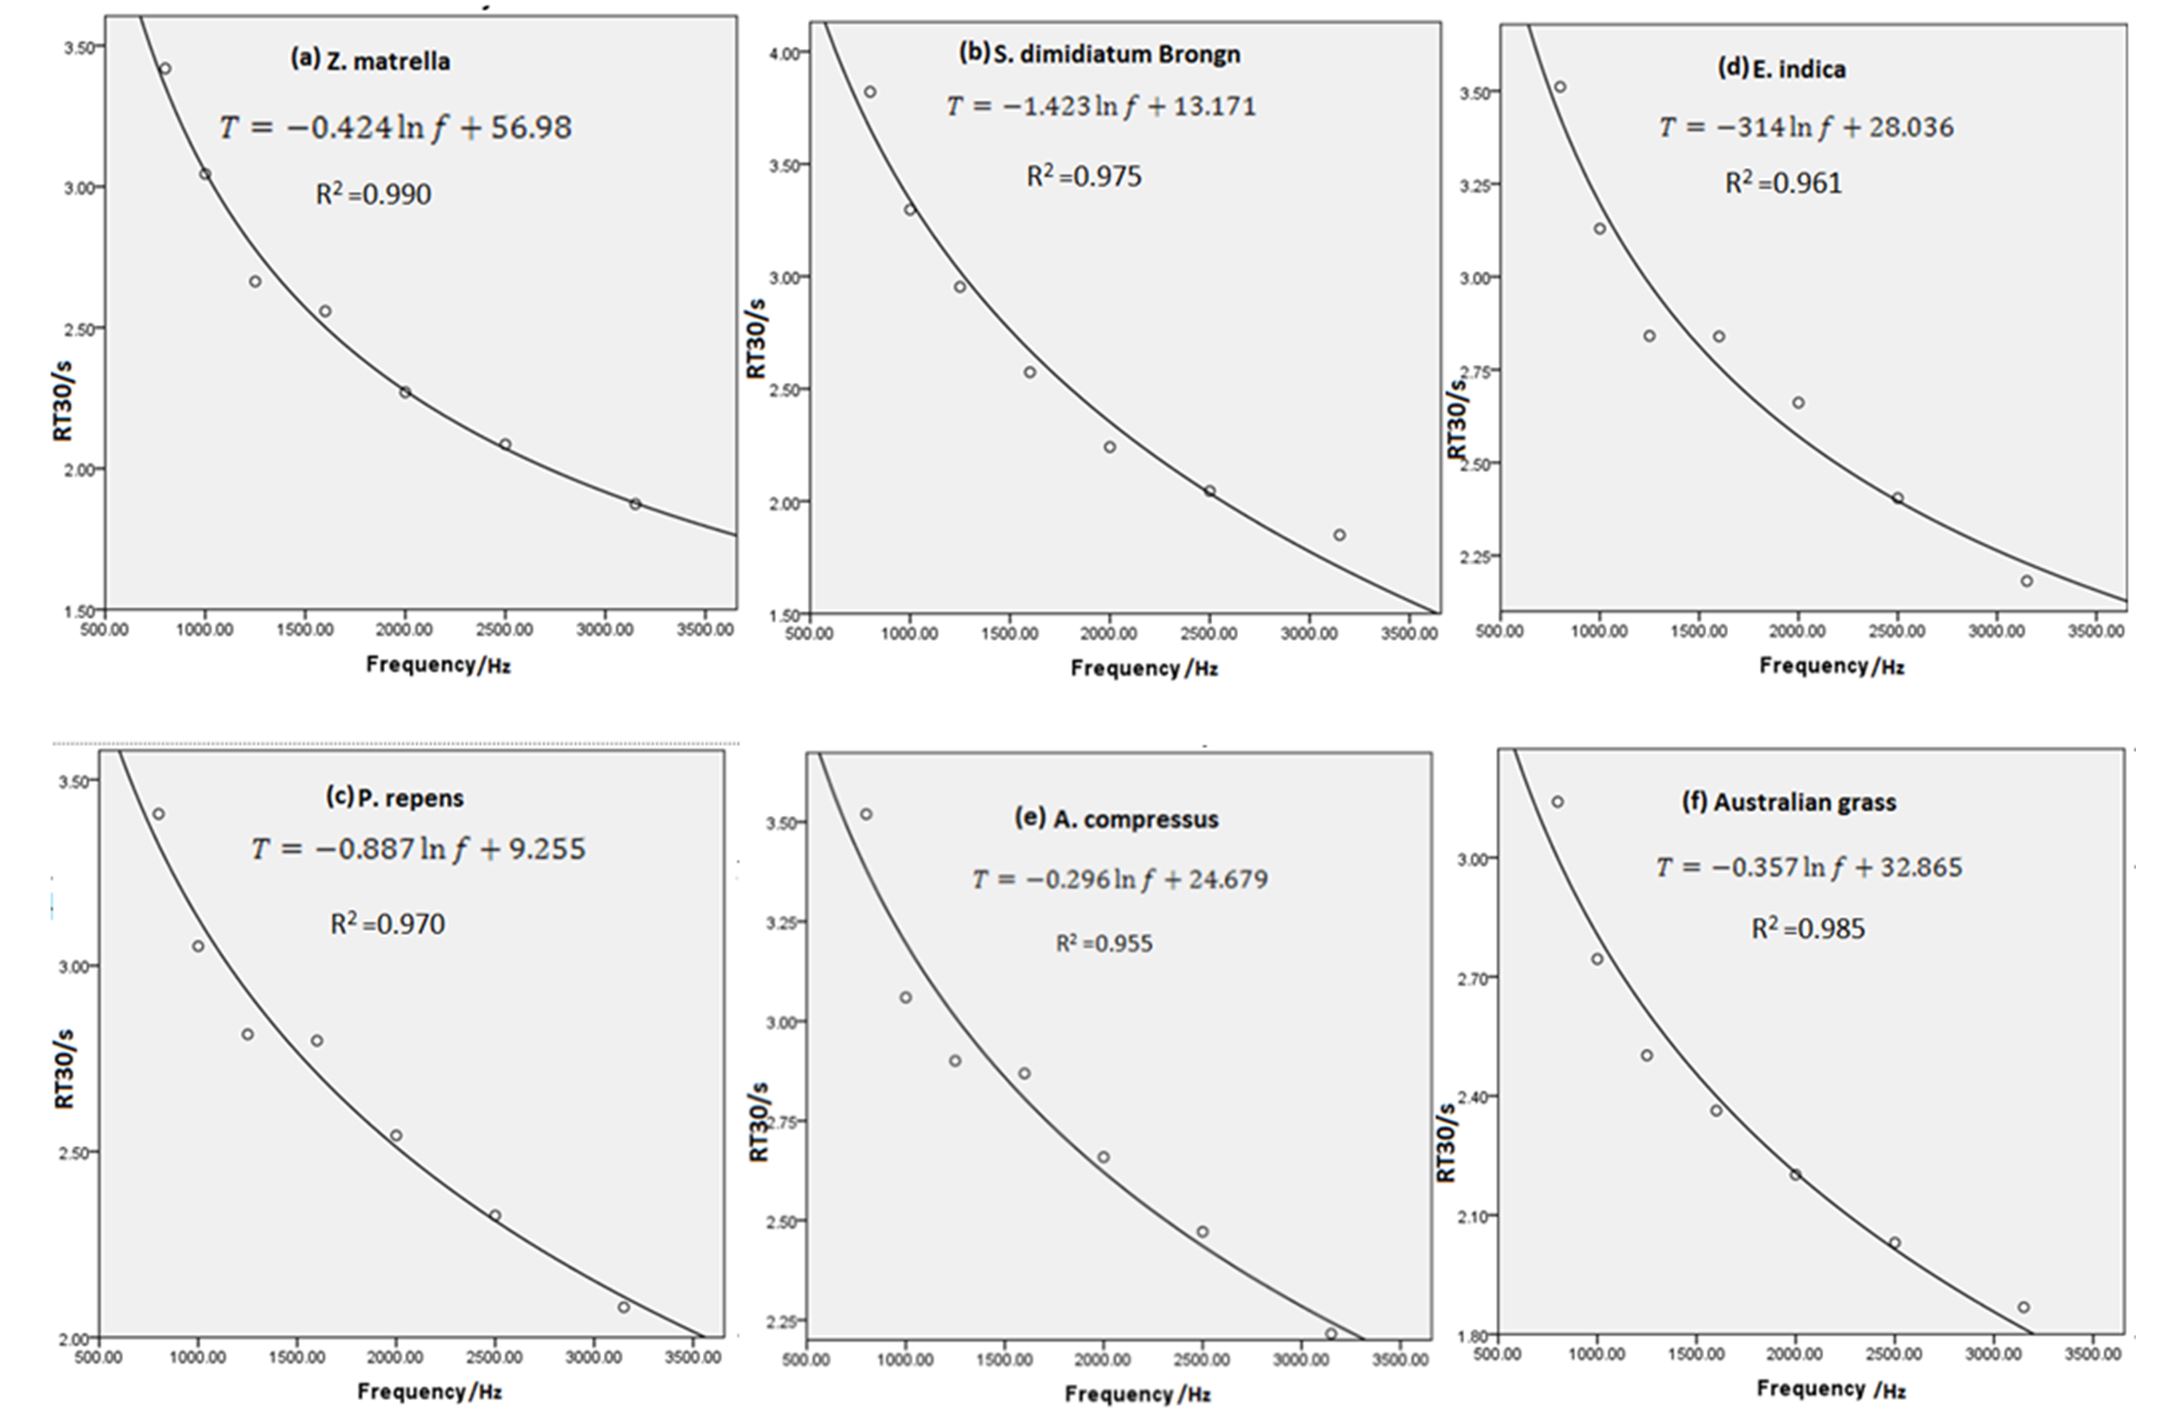
Figure 6 – Fitted curves for RT30 with the frequency of the incident sound wave for six grass species (a) Z. matrella, (b)S. dimidiatum(L)Brongn, (c)P. repens, (d) E. indica, (L) Gaertn., (e) A. compressus (Sw) P. Beauv, (f). Ischaemum sp

Figure 7 – Fitted curves for SAC with the frequency for grass species (a) Z. matrella, (b)S. dimidiatum(L)Brongn, (c)P. repens, (d) E. indica (L) Gaertn., (e) A. compressus (Sw) P. Beauv, (f). Ischaemum sp
All the mathematical models obtained using SPSS are in the form of RT30 = a1 ln f + b1, where a1 and b1 are grass type-dependent constants. A significant value has a p less than 0.05. The fitted lines for SAC with powerful R squared values are shown in Fig. 7.
The four data sets fit logarithmic equations, but the trend patterns differ. A. compressus has a decreasing trend pattern, and the other three grass species have increasing trend patterns.
P. repens, E. indica have random variations. Smyrnova et al. (2010) have previously taken growing and decaying SAC vs frequency graphs for different plant types. The results of both studies are similar.
The SAC of S. dimidiatum Brongn positively correlated with noise frequency (R2=0.95), but Z. matrella, Ischaemum sp., and A. compressus reasonably relate. The correlation of SAC (α) with frequency (p < 0.05) is in the form of log10α = a2log10f + b2 where a2 and b2 are grass type-dependent constants, and f is the noise frequency. The above stimulating noise absorption behaviours were further studied by analysing their morphological nature. The parameters studied were leaf thickness, leaf area, leaf length, leaf width, hair length, plant height, total and dry weight of the sample, total leaf area, and sample area. Table 2 shows the averaged values obtained by ten measurements of each parameter.
Table 3 gives the coefficients of determinations (R squared values) for the studied parameters. This study suggests that the acoustic behaviour of plants in different frequencies is diverse. For noise frequencies of 800 Hz and 1250 Hz, the most impactful morphological parameter is the total leaf area. The sample area affects SAC parameters for 800 Hz and 1250 Hz. At 1600 Hz, the height of the sample is the main determiner. There was a significant effect on SAC in the range of 1600 Hz-3150 Hz due to the plant height. According to Table 3, the thickness of a leaf and surface area, length of a leaf, sample weight, and leaf width did not alter SAC throughout the range of frequencies. Fig. 8 illustrates the highly correlated variables for noise absorption under different frequencies.
The length of the hairs (trichomes) was measured for each plant variety using microscopic images and ImageJ software. Zoysia matrella, Ischaemum sp., Axonophus, and Panicum repens had a few hairs at the leaf bottoms. The hair lengths were 3.2 mm, 0.73 mm, 3.24 mm, and 0.24 mm, respectively. Only Stenotaphrum dimidiatum (L) Brongn and Eleusine indica had trichomes on the upper leaf surface. The length of the hairs was 0.39 mm and 4.18 mm, respectively.
Though the hair densities on the leaf’s upper body were 5 cm-2 and 10 cm-2, the hair density varied greatly from plant to plant. The maturity and soil conditions were mainly affected by hair density. Stenotaphrum dimidiatum (L) Brongn and Axonophus had hairs on the leaves’ edges, and the length of the hairs was about 0.7 mm. The linear hair density of both plant varieties was about 13 hairs per one centimetre. There were no branched hairs on the selected plant varieties.
Table 2
Measured morphological parameters of leaves
|
Scientific Name |
Morphological/Anatomical features (Mean) |
|||||||||
|
Leaf thickness (103 mm) |
Hair length (mm) |
Leaf area (cm2) |
Leaf length (101 mm) |
Leaf width (mm) |
Plant height (101 mm) |
Sample weight (kg) |
Dry sample weight (kg) |
Sample area (m2) |
Total leaf area (m2) |
|
|
Zoysia matrella |
86.95 |
0.00 |
2.09 |
2.0 |
0.0 |
0 |
0.50 |
0.58 |
0.37 |
0.12 |
|
Stenotaphrum dimidiatum(L) Brongn |
103.33 |
0.39 |
0.03 |
0.5 |
0.0 |
2 |
0.21 |
0.26 |
0.75 |
0.28 |
|
Panicum repens |
49.29 |
0.00 |
0.02 |
0.9 |
0.0 |
5 |
0.09 |
0.47 |
0.35 |
0.46 |
|
Eleusine indica |
109.70 |
0.18 |
0.78 |
6.0 |
0.0 |
0 |
0.67 |
0.81 |
0.04 |
0.76 |
|
Axonopus compressus |
90.58 |
0.00 |
0.32 |
8.2 |
0.0 |
0.5 |
0.32 |
0.98 |
0.30 |
0.20 |
|
Ischaemum sp. |
49.31 |
0.00 |
0.29 |
2.3 |
2.0 |
4.5 |
9.03 |
0.35 |
4.21 |
8.42 |
Table 3
R-squared values for each parameter and SACs
|
|
R squared values (coefficient of determination) for SACs |
||||||
|
Frequency/Hz |
800 |
1000 |
1250 |
1600 |
2000 |
2500 |
3150 |
|
Leaf thickness |
0.17 |
0.06 |
0.24 |
0.04 |
0.11 |
0.06 |
0.09 |
|
Leaf surface area |
0.13 |
0.20 |
0.13 |
0.07 |
0.10 |
0.11 |
0.12 |
|
Length of a leaf |
0.49 |
0.58 |
0.52 |
0.11 |
0.14 |
0.10 |
0.12 |
|
Width of a leaf |
0.25 |
0.08 |
0.42 |
0.11 |
0.17 |
0.16 |
0.17 |
|
Total leaf area |
0.89 |
0.90 |
0.93 |
0.05 |
0.16 |
0.07 |
0.11 |
|
Sample area |
0.88 |
0.73 |
0.98 |
0.50 |
0.37 |
0.35 |
0.30 |
|
Plant Height |
0.74 |
0.68 |
0.68 |
0.83 |
0.94 |
0.90 |
0.93 |
|
Sample Weight |
0.25 |
0.36 |
0.18 |
0.01 |
0.09 |
0.05 |
0.10 |
|
Dry weight of the sample |
0.70 |
0.80 |
0.25 |
0.50 |
0.63 |
0.54 |
0.59 |

Figure 8 – The best-fitted curves under respective frequencies, (a) SAC vs total leaf area, (b) SAC vs sample area, (c) SAC vs plant height, (d) SAC vs dry weight of the sample.
CONCLUSIONS
S. dimidiatum had the highest SAC values for frequencies above 1500 Hz and is recommended for higher frequency noise absorption. For lower frequencies (< 1500 Hz), the noise absorption capability of E. indica was significant. A. compresus showed the lowest SAC for higher noise frequencies (> 1600 Hz) and the highest RT30 over the considered frequency range. The characteristic variation pattern of reverberation time RT30 with sound frequency was similar for all tested grass types at higher frequencies (> 1600 Hz). For lower frequencies (< 1600 Hz), random variations of reverberation time and SAC with noise frequency were observed.
Morphological parameters like total leaf area, total sample area, plant height, and sample dry weight strongly correlated with the SAC. But the leaf thickness, length, width, surface area, and sample weight poorly correlated with SAC for the entire range of frequencies. The SAC for the frequency range of 1600 Hz-3150 Hz depended on the plant’s height. The total leaf area was not affected by SAC at higher frequencies (1600 Hz-3150 Hz). Epidermal hairs, categorised in many ways like unicellular, cellular, single branches, multi branches, etc., played different roles in noise absorption. However, there were no branched hairs on the selected plant varieties. If a leaf contained longer trichomes, water molecules were deposited and percolated through them creating an extra dragging force against their vibrations. It was disturbed by the insertion of sound waves through the cuticles into the leaf which decreased sound absorption. Since the sound waves move back and forth, it was easy to move a thin leaf. Therefore, thin plant leaves showed high SACs. More studies on the structures of epidermal hairs are needed to understand the acoustic behaviour of plant leaves.
Acknowledgement. UGC Block Grant (Ru/PG-R/16/12) is acknowledged.
REFERENCES
Asdrubali, F., D’Alessandro, F., Mencarelli, N., & Horoshenkov, K. V. (2014). Sound absorption properties of tropical plants for indoor applications. The 21st International Congress on Sound and Vibration, 1-8, Beijing.
Berglund, B., Lindvall, T., & Schewela, D. H. (1995). Guidelines for community noise, Geneva: WHO.
Bucur, V. (2006). Noise attenuation with plant material. In Urban forest acoustics, 43-110, Heidelberg, Berlin: Springer. https://doi.org/10.1007/3-540-30789-3_4
Carlisle, E. J., & Hooker, R. J. (2004). Small chamber reverberant absorption measurement. In Proceedings of Acoustics 2004, 3-5, Australia.
del Rey, R., Alba, J., BertóCarbó, L., & Gregori, A. (2017). A Small sized reverberation chamber for the measurement of sound absorption. Materiales de Construcción, (67 (328)), 1-9. http://dx.doi.org/10.3989/mc.2017.07316
Dobson, M., & Ryan, J. (2000). Trees & shrubs for noise controlling, 2-6, Arboricultural advisory and information service.
Fong, S., & Johnston, M. (2000). Health effects of noise. Toronto: Toronto Public Health Promotion and Environment Protection Office.
Horoshenkov, K. V., Khan, A., & Benkreira, H. (2013). Acoustic properties of low growing plants. The Journal of the Acoustic society of America (133(5)), 2554-65.
https://doi.org/10.1121/1.4798671
Hughes, W. O., McNelis, A. M., Nottoli, C., & Wolfram, E. (2015). Examination of the Measurement of Absorption Using the Reverberant Room Method for Highly Absorptive Acoustic Foam. In proceedings of the 29th Aerospace Testing Seminar, 1-4.
(2003). ISO 354:2003. Acoustics – Measurement of sound absorption in a reverberation room, Geneva.
Martens, M. J., & Michelsen, A. (1981). Absorption of acoustic energy by plant leaves. Journal of Acoustical society of America (69(1)), 303-306.
https://doi.org/10.1121/1.385313
Prisutova, J., Horoshenkov, K. V., Groby, J. P., & Brouard, B. (2014). Laboratory measurement of the acoustic absorption coefficient of living plants via modal dispersion. In CD-ROM proceedings of the 21st International congress of sound and vibration, 13-17, Beijing. http://dx.doi.org/10.1121/1.4830605
Rasa, A. (2016). Development of a small scale reverberation room. In proceedings of Acoustics, 9-11, Australia.
Sagartzazua, X., Hervellab, L., & Pagalday, J. M. (2007). Review in Sound Absorbing Materials. Archives of Computational Methods in Engineering.
Smyrnova, Y., Kang, J., Cheal, C., Tijs, E., & de Bree, H. E. (2010). Laboratory test of sound absorption of vegetation. In proceedings of the Congress of sound and vibration, Slovenia.
Watanabe, T., & Yamada, S. (1996). Sound attenuation through absorption by vegetation. Journal of the Acoustical Society of Japan (E) (17(4)), 175-82. https://doi.org/10.1250/ast.17.175
Wong, N. H., Tan, A. Y., Tan, P. Y., Chiang, K., & Wong, N. C. (2010). Acoustics evaluation of vertical greenery systems for building walls, Building and Environment, 411–420.
https://doi.org/10.1016/j.buildenv.2009.06.017
Yang, H. S., Kang, J., & Cheal, C. (2013). Random incidence absorption and scattering coefficients of vegetation, Acta Acustica united with Acustica (99(3)), 379-388.
https://doi.org/10.3813/AAA.918619
Amarasingha N.D., Bodhika J.A.P., Dharmaratna W.G.D., Jayatissa L.P.

