Oluwole John Pelemo, Sadioluwa O. Afolabi, Maureen O. Ogoliegbune, Monisola B. Awosusi, Mayowa J. Mephors, David O. Ayeni, Sadiat I. Adamu
ABSTRACT. The use of ground-based multispectral data for the evaluation of plant water stress and nitrogen status in Old Oyo national Park, Nigeria was conducted and classification was performed. The active area of nitrogen concentration in hectares was between 0.0 and 0.4. This active area was expressed in hectares (ha) and percentages (%) respectively. From the assessment, 53.52 ha (69%) and 24.29 ha (31%) were recorded at 0.2-0.4 and 0.0-0.2, respectively. Heat stress takes place when the regular temperature is above 30ºC, which could slow down plant growth and lead to the threat of deficiency. The heat stress reached a maximum of 40ºC in this analysis between February and May. The research concluded that the sustainability of crops and trees requires a certain quantity of 69 percent nitrogen and a certain level of wetness for their growth which is between 400 mm and 800 mm rainfall.
Keywords: heat stress, temperature, drought, land cover changes.
Cite
ALSE and ACS Style
Pelemo, O.J.; Afolabi, S.O.; Ogoliegbune, M.O.; Awosusi, M.B.; Mephors, M.J.; Ayeni, D.O.; Adamu, S.I. Nitrogen status and canopy density detection of vegetation using multispectral data. Journal of Applied Life Sciences and Environment 2021, 54(2), 156-165.
https://doi.org/10.46909/journalalse-2021-015
AMA Style
Pelemo OJ, Afolabi SO, Ogoliegbune MO, Awosusi MB, Mephors MJ, Ayeni DO, Adamu SI. Nitrogen status and canopy density detection of vegetation using multispectral data. Journal of Applied Life Sciences and Environment. 2021; 54(2): 156-165.
https://doi.org/10.46909/journalalse-2021-015
Chicago/Turabian Style
Pelemo, Oluwole John, Sadioluwa O. Afolabi, Maureen O. Ogoliegbune, Monisola B. Awosusi, Mayowa J. Mephors, David O. Ayeni, and Sadiat I. Adamu. 2021. “Nitrogen status and canopy density detection of vegetation using multispectral data” Journal of Applied Life Sciences and Environment 54, no. 2: 156-165.
https://doi.org/10.46909/journalalse-2021-015
View full article (HTML)
Nitrogen Status and Canopy Density Detection of Vegetation Using Multispectral Data
Oluwole John Pelemo1,*, Sadioluwa O. Afolabi1, Maureen O. Ogoliegbune1, Monisola B. Awosusi2, Mayowa J. Mephors1, David O. Ayeni3, Sadiat I. Adamu2
1Forestry Research Institute of Nigeria – Remote Sensing and GIS Section
2Forestry Research Institute of Nigeria – Climate Change Section
3Forestry Research Institute of Nigeria – Meteorology Section
*E-mail: pelemo03@yahoo.com
Received: May 07, 2021. Revised: May 21, 2021. Accepted: July 29, 2021. Published online: July 31, 2021
ABSTRACT. The use of ground-based multispectral data for the evaluation of plant water stress and nitrogen status in Old Oyo national Park, Nigeria was conducted and classification was performed. The active area of nitrogen concentration in hectares was between 0.0 and 0.4. This active area was expressed in hectares (ha) and percentages (%) respectively. From the assessment, 53.52 ha (69%) and 24.29 ha (31%) were recorded at 0.2-0.4 and 0.0-0.2, respectively. Heat stress takes place when the regular temperature is above 30ºC, which could slow down plant growth and lead to the threat of deficiency. The heat stress reached a maximum of 40ºC in this analysis between February and May. The research concluded that the sustainability of crops and trees requires a certain quantity of 69 percent nitrogen and a certain level of wetness for their growth which is between 400 mm and 800 mm rainfall.
Keywords: heat stress, temperature, drought, land cover changes.
INTRODUCTION
Nitrogen’s contribution to plants has made it important for plant growth. It aids photosynthetic activity, as studied by Kokaly. Plants that have nitrogen deficiencies show visual indications in their leaves known as chlorosis has confirmed by Xue et al. (2020). Nitrogen is an important nutrient in agricultural areas that contributes to global food production. Numerous vegetation indices have been recognised to evaluate chlorophyll content at the canopy level in plant assessment. However, a study on the estimation of land cover changes (LCCs) using a vegetation index method with crop canopy spectra is moderately inadequate and deficient. As observed, the applications of remotely sensed data have been used for the detection of relative differences in plant canopy density (Inman et al., 2005). Remotely sensed reflectance data have been associated with plant features such as plant biomass or the fraction of intercepted photosynthetically active radiation (Chen & Black, 1991). Both the red and near-infrared portions of the spectrum have been predominantly useful in vegetation monitoring. This is because crop canopy spectra are affected by not only leaf biochemical parameters and leaf distribution but also other contributing factors, including crop canopy structure, soil nutrients and atmosphere. Nitrogen content is a measure and an essential indicator of the nutritional level and health status of vegetation. Nitrogen deficit significantly decreases the photosynthetic yield of crops, while excessive application of nitrogen fertiliser can cause stress to crops and environmental pollution, as indicated by Inman et al., (2005). Therefore, information on the nitrogen contents of crop leaves must be acquired for scientific and rational decision-making in agronomy (Schlemmer et al. 2013).
There have been a series of studies that have discussed the properties of different indices. Data available from remote sensing data through satellites and airborne sensors have great potential to offer information on vegetation biophysical variables over wide spatial and temporal scales. Many authors defined LAI as one-half the total leaf area per unit ground surface area. Chen & Black (1991) defined LAI as a biophysically important variable for assessing foliage cover and biomass production. The LAI can therefore be adapted to monitor and project crop growth and yield, as proven by Clevers et al. (2017) and Jay et al. (2019). In addition, the leaf chlorophyll content (LCC) offers appreciable information about the nutrition and photosynthesis status of agricultural crops. Vegetation-index-based methods have been broadly used in crop management studies for the non-destructive estimation of LCC by applying remote sensing technology. The clear quantification of vegetation biophysical variables on large spatial scales as propounded by Clevers et al. (2017) is an important aspect in agricultural management and monitoring.
Q. Xie et al. (2015) were of the opinion that the understanding of the spatial distribution of leaf area index (LAI) and chlorophyll content can be used to improve the use of resources, such as fertiliser and water. This could enhance better yields and minimised costs as ascertained by Jay et al. (2019). According to Jay et al. (2019), the leaf chlorophyll content (LCC), which includes the contents of chlorophyll a and chlorophyll b, provides crucial information for understanding vegetation stress (Clevers et al., 2017; Xie et al., 2015) physiological status, and photosynthesis potential.
Remote sensing
and nitrogen estimation
The use of remote sensing data from satellites and airborne sensors has great potential in the provision of information on vegetation biophysical variables over large spatial and temporal scales. Various earth and cloud surface temperatures, rainfall, soil moisture, radiation, crop and plant yield assessments based on spectral indices, among others, can be worked out using remotely sensed data. Leaf area index (LAI or one half of the total leaf area per unit ground surface area as defined by Chen and Black, 1991), is a biophysical key variable for assessing foliage cover and biomass production. Several sensitive spectral structures and vegetation indices have been evaluated for crop N estimation.
According to Kokaly (2001), the leaf N concentration (LNC, %) in rice can be assessed by two reflectance absorptions at 2054 nm and 2172 nm. The application of hyperspectral remote sensing technology can be used to rapidly evaluate the spatiotemporal variations in vegetation nitrogen content on a macro scale at a relatively low cost when compared to the cost of field measurements (Wei et al., 2008; Zheng et al., 2018). Currently, several research scientists have made important progress in assessing the nitrogen contents in crops, such as wheat using hyperspectral indices (Gitelson et al., 2005; Zhou et al., 2016; Wei et al., 2008; Zheng et al., 2018).
Aim of the study
This study aimed to evaluate nitrogen status and canopy density detection in vegetation using multispectral data.
MATERIALS AND METHODS
Many experimental methods have been used in the assessment of nitrogen in the forest. Applying various vegetation indices are the simplest and most used methodologies to estimate leaf biochemical nitrogen contents. The technology has been able to work out spectral indices on earth and cloud surface temperatures, radiation, rainfall, soil moisture and crop yield estimates. The digital number (DN) values of the images of the study area were converted into reflectance values per band. This was performed by applying the observed line model resulting from the measured reflectance values and DN values of the calibration images. An area of interest (AOI) of a permanent size was defined in the non-sampling area of each plot, which was applied for each flight campaign. The mean value of AOI extracted from the reflectance image for each growth stage was used to characterise the reflectance of each plot. Available pixels in each AOI were used irrespective of vegetation or non-vegetation pixels.
Crop and vegetation monitoring at consistent intervals during the plant growth cycle is essential to respond appropriately and to assess information on probable loss of production. The remote-sensing-based methodologies can provide information on the occurrence and the aerial extent of plant stress. NDRE is a spectral index that is built as a blend of several bands: the near-infrared (NIR) spectrum and a band that uses a narrow spectral range between visible Red and NIR. This index is very similar to the more common and powerful analogue with a greater history, NDVI.
Red-edge Normalised Difference Vegetation Index: NDRE = (NIR – RE) / (NIR + RE)
Study area
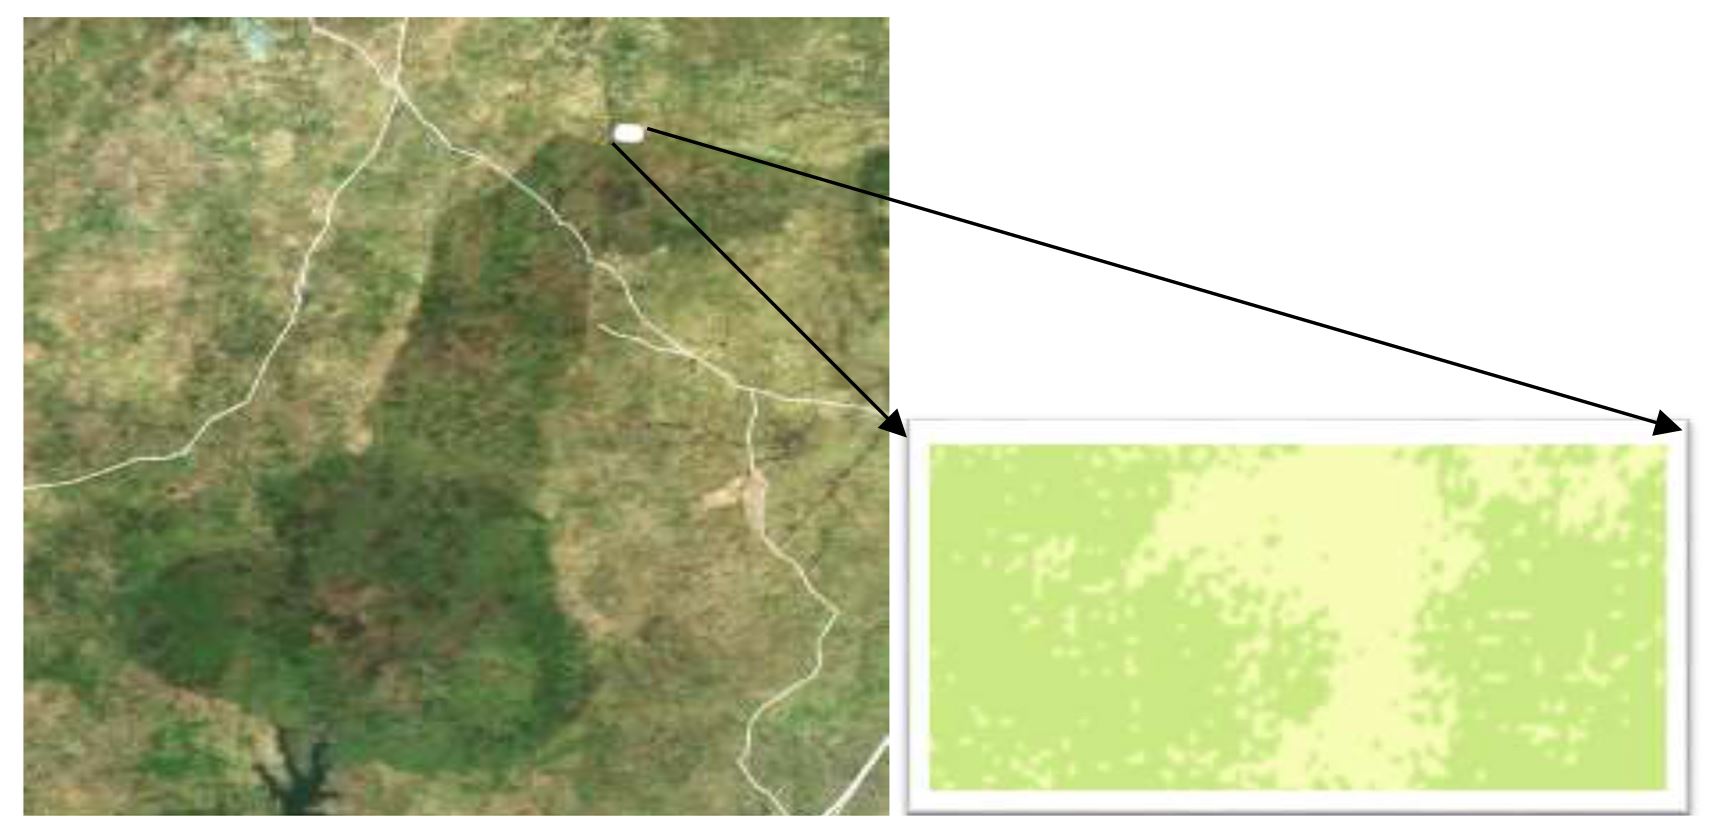
The study area is at the northern side of the Old Oyo National Park, Nigeria, with an area of 78.4 ha at latitude 9.0299º N and longitude 4.0681º E. This study was carried out in September 2020.
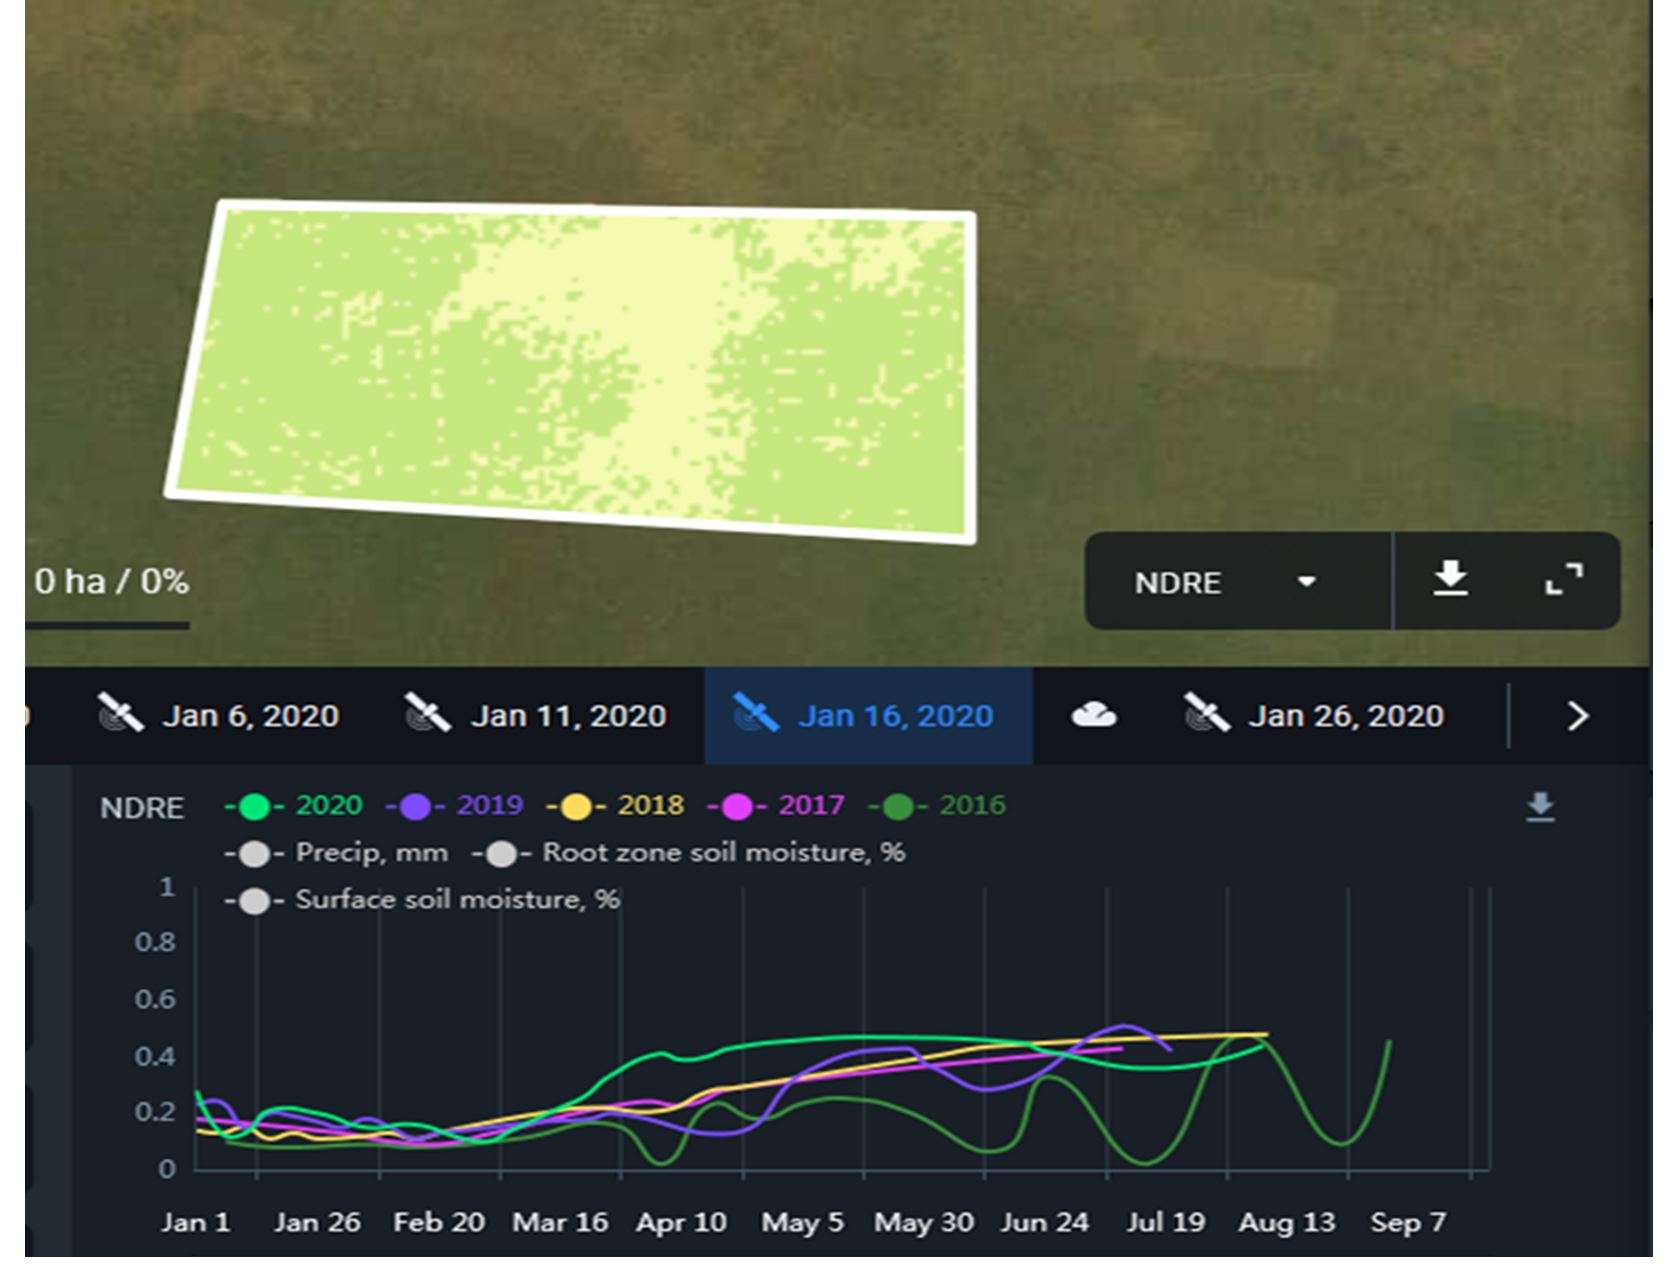
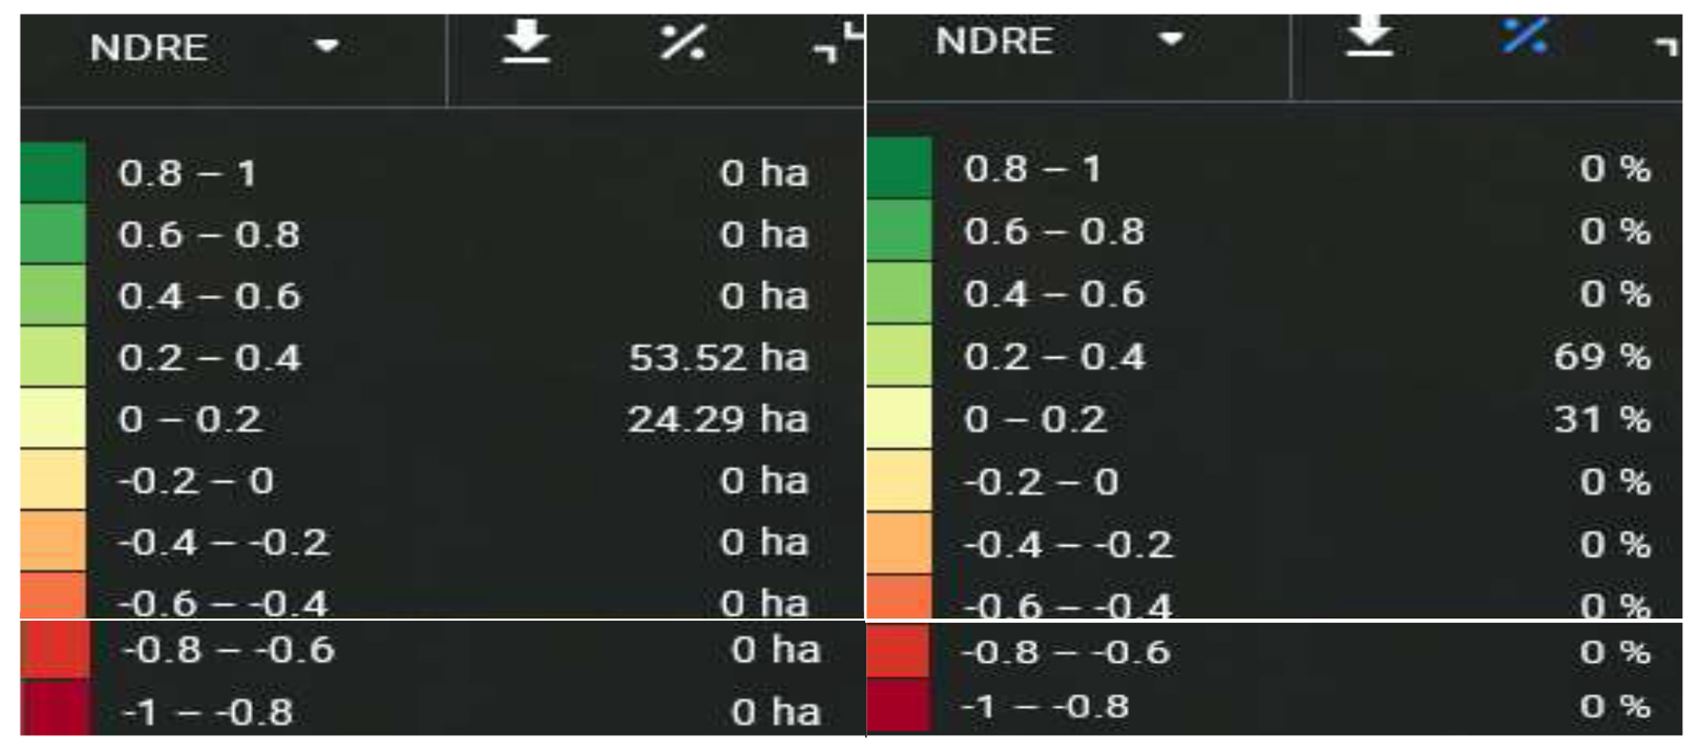
The Figure 2 below shows the level of nitrogen availability in the study area. These results indicate the photosynthetic activity of the vegetation cover, which was used to estimate the concentrations of nitrogen in plant leaves for a period of time. NDRE values range between -1 and 1, as indicated in the figure below. The active area of nitrogen concentration was between 0.2 ha and 0.4 ha. This was expressed in hectares (ha) and percentages (%) respectively. From the assessment, 53.52 ha (69%) and 24.29 ha (31%) were found in 0.2-0.4, and 0.0-0.2 respectively. It could be deduced from this result that the oppressed and ageing vegetation could be detected, and plant diseases can be identified. In agriculture, the timing of the harvest can be optimised. Since there is a close relationship between nitrogen and vegetation growth, a deficiency or a variation of nutrient supply will cause a change in crop canopies resulting in detectable canopy reflectance or temperature variation as corroborated by Clevers et al. (2017) and Sclemmer et al. (2013). Nitrogen is an essential element for plant growth. When N deficiency in pear orchards resulted in low vigour and reduced yield, while N excess caused high vigour and poor fruit quality. Because of nitrogen’s direct relation to chlorophyll, healthy vegetation is shown in specific vegetation indices, considering the chlorophyll’s activity in the blue, red, green and near-infrared regions (Inman et al., 2005). Nevertheless, a disadvantage to the common NDVI is that its values are saturated with the response variable (e.g. nitrogen and leaf area index) once the canopy has become dense (Xie et al., 2018).
Figure 3 below expresses the yearly NDRE between 2016 and 2020, respectively. There was an irregular concentration of nitrogen in 2016. At the beginning of 2016, it was as low as 0.1. in April, May, and July, the NDRE hit almost a zero level. Other years have close values as indicated.
The modified normalised difference index with a blue band (mNDblue) was proposed by Jay et al. (2019) as a strong indicator of crop chlorophyll content with a weak effect of soil background. The green band chlorophyll index (CIgreen) and the red edge chlorophyll index (CIred-edge) have been proven to be accurate predictors of the leaf (Gitelson et al., 2003a; Schlemmer et al., 2013) and canopy chlorophyll contents (Gitelson 2005; Schlemmer et al., 2013; Clevers et al., 2017). These VIs were selected to represent the differences in band combination, and sensitivity to soil background, biomass and chlorophyll content (Zheng et al., 2018).
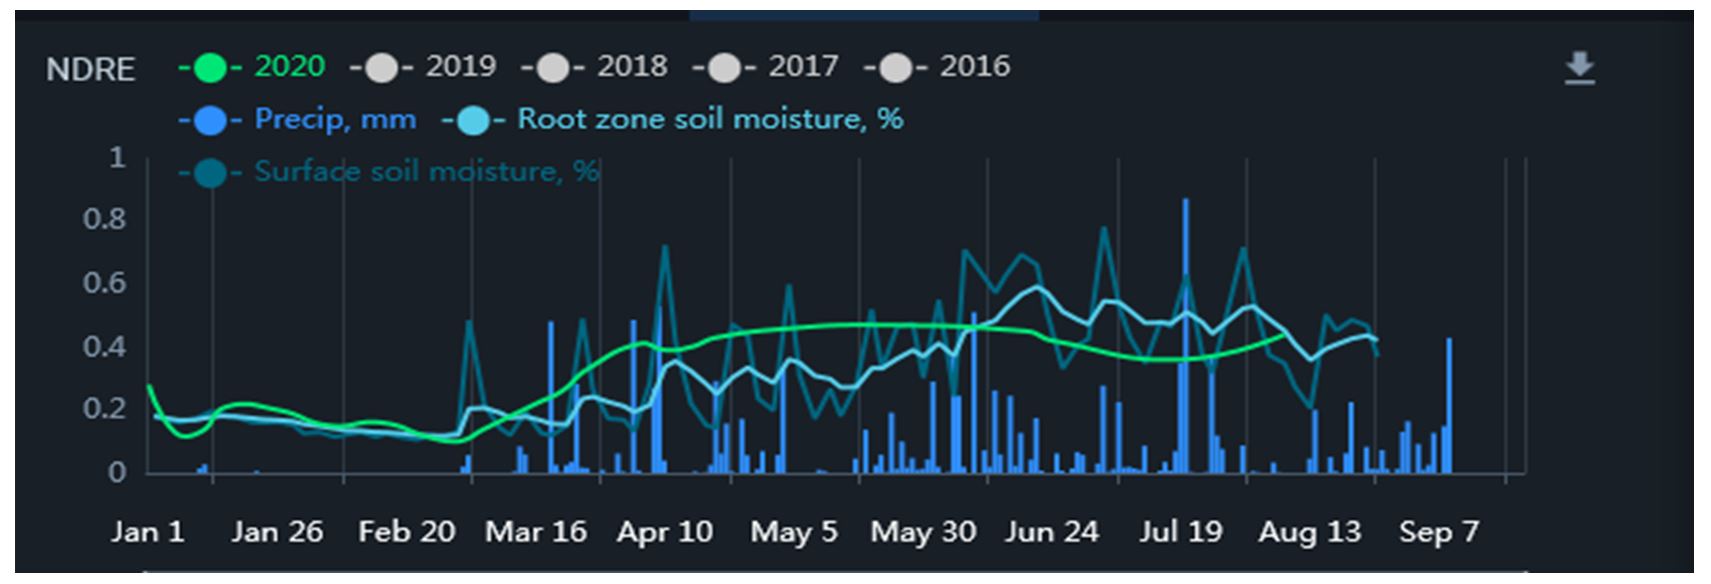
Figure 4a below shows the amount of rainfall and the dynamics of moisture accumulation on the surface of the soil and in the root zone. The peak of the rainfall period was in July, and the soil moisture level was at its peak in June. From the results below, it was easiest to assess the probability of droughts, flooding and prolonged rainfall period. The excess rainfall can lead to the emergence of harmful fungi and soil erosion. In the agricultural sector, this can be used to analyse the patterns of their influence on crop growth.
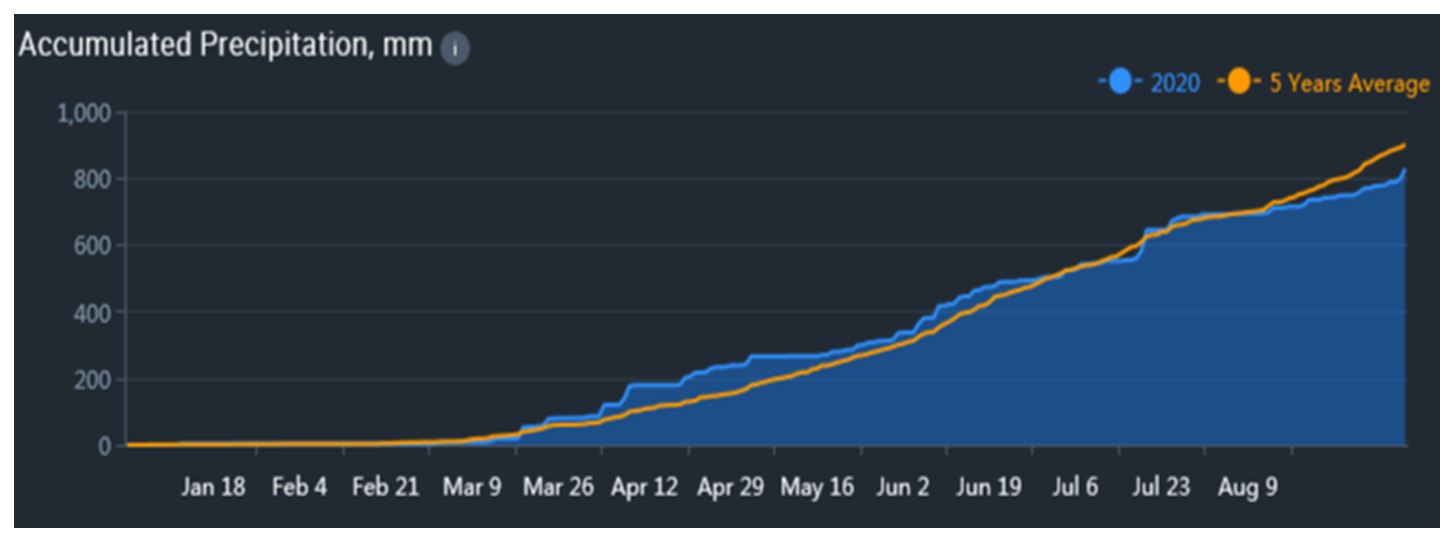
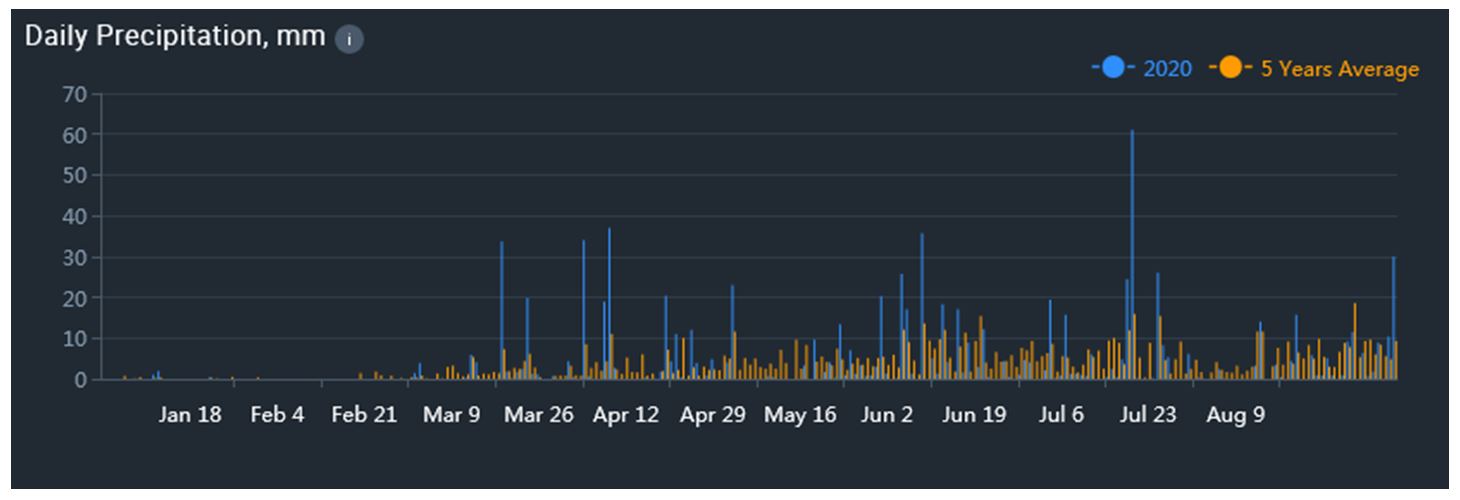
In Figure 4b, the accumulated rainfall was recorded for the period of study. From the graph, it showed that rainfall started accumulating from March at the zero (0) level. Within the period of one month, it reached 200 mm. This was a result of the beginning of the rainy season. In June, it reached 400 mm, in July, 600 mm, and in September, it reached 800 mm. Figure 4c, which shows the daily rainfall, has a similar pattern to figure 4b. The peak period of assessment was July, and July happened to be the peak period of rainfall in the study area.
Figure 5a below indicated the maximum and minimum daily temperature available in the study area. This allowed for the detection of anomalies associated with the vegetation. Such anomalies include heat and cold stress. Heat stress occurs when the average temperature is above 30ºC, which could actually slow down plant growth and thereby lead to the threat of deficiency. On the other hand, cold stress occurs when the temperature drops below -6ºC, which can lead to the destruction and death of plants. The heat stress reached a 40ºC maximum in this analysis, and this occurred between February and May. In agreement with the above statement that any temperature above 30ºC could lead to the threat of drought, in the analysis below, there was an excess in temperature of 10ºC, which invariably will spell doom for plants during this period.
In Figures 5, 6, 7 and 8 below showed the daily minimum and maximum temperatures for their 5-year average. As indicated in the figure 5 above, the 2020 maximum temperature was as low as 25ºC and as high as 35ºC. This almost has an association with the 5-year average maximum temperature. The area also experienced minimum temperatures as low as 15ºC and high as 25ºC, with corresponding 5-year average minimum temperatures. Figure 7 gives accounts of the sum of active temperatures for the year 2020. The rate indicated that there was an increase in temperature from the beginning of the year.
CONCLUSIONS
The application of advanced remote sensing techniques and remotely sensed data have been widely used to exactly and non-destructively monitor crop chlorophyll contents. The traditional measurement approach in the laboratory is relatively time and labour-consuming. This makes it difficult to meet the practical demands of precise vegetation controll in large fields. Conversely, this makes support obvious for the usage of such indexes to evaluate N concentration in Eucalyptus trees with the approach of the use of NDRE remote sensing practices for nitrogen assessment in the forest cover. Such techniques are also in practice in precision agriculture, which are being investigated in studies with different farmlands. The highest nitrogen quantity was centralised at the middle level of the study area as indicated in the amount of rainfall and the dynamics of moisture accumulation on the surface of the soil and in the root zone. There is the probability of droughts in some periods, while flooding and rainfall periods could also occur where there could be an emergence of harmful fungi and soil erosion due to excess rainfall. In decision making, this can be used to analyse the patterns of their influence on crop growth. The maximum and minimum daily temperatures experienced in the study area allow for the detection of anomalies around the vegetation. The heat stress experienced here could slow down plant growth and thereby lead to the effect of water deficiency. Since the study area was a tropical region, cold stress only occurs when the temperature drops below -6ºC. This can lead to the devastation and death of plants; therefore, excesses in temperature of 10ºC will invariably spell doom for plant growth. This paper concludes that this technique is appropriate to evaluate nitrogen distribution in the study area.
REFERENCES
Ceccato, P., Flasse, S., Tarantola, S., Jacquemoud, S., & Grégoire, J.-M. (2001). Detecting vegetation leaf water content using reflectance in the optical domain. Remote Sensing of Environment, 77(1), 22–33. DOI: 10.1016/s0034-4257(01)00191-2
Clevers, J., Kooistra, L., & van den Brande, M. (2017). Using Sentinel-2 Data for Retrieving LAI and Leaf and Canopy Chlorophyll Content of a Potato Crop. Remote Sensing, 9(5), 405. DOI: 10.3390/rs90504 05
Gitelson, A. A. (2005). Remote estimation of canopy chlorophyll content in crops. Geophysical Research Letters, 32(8). DOI: 10.1029/2005gl 022688
Inman, D., Khosla, R., & Mayfield, T. (2005). On‐the‐go active remote sensing for efficient crop nitrogen management. Sensor Review, 25(3), 209–214. DOI: 10.1108/026022805 10606499
Jay, S., Baret, F., Dutartre, D., Malatesta, G., Héno, S., Comar, A., … Maupas, F. (2019). Exploiting the centimeter resolution of UAV multispectral imagery to improve remote-sensing estimates of canopy structure and biochemistry in sugar beet crops. Remote Sensing of Environment, 231, 110898. DOI: 10.1016/j.rse.2018.09.011
Chen, J. M., & Black, T. A. (1991). Measuring leaf area index of plant canopies with branch architecture. Agricultural and Forest Meteorology, 57(1-3), 1–12. DOI: 10.1016/0168-1923(91)90074-z
Kokaly, R. F. (2001). Investigating a Physical Basis for Spectroscopic Estimates of Leaf Nitrogen Concentration. Remote Sensing of Environment, 75(2), 153–161. DOI: 10.1016/s0034-4257(00)00163-2
Schlemmer, M., Gitelson, A., Schepers, J., Ferguson, R., Peng, Y., Shanahan, J., & Rundquist, D. (2013). Remote estimation of nitrogen and chlorophyll contents in maize at leaf and canopy levels. International Journal of Applied Earth Observation and Geoinformation, 25, 47–54. DOI: 10.1016/j.jag.2013.04. 003.
Murray, V. & Ebi, K.L. (2012). IPCC special report on managing the risks of extreme events and disasters to advance climate change adaptation (SREX). J. Epidemiol. Commun. H., 66(9): 759-760, DOI: 10.1136/jech-2012-201045
Wei, F., Yan, Z., Yongchao, T., Weixing, C., Xia, Y., & Yingxue, L. (2008). Monitoring leaf nitrogen accumulation in wheat with hyper-spectral remote sensing. Acta Ecologica Sinica, 28(1), 23–32. DOI: 10.1016/s1872-2032(08)60018-9
Xie, Q., Dash, J., Huang, W., Peng, D., Qin, Q., Mortimer, H., Ye, H. (2018). Vegetation Indices Combining the Red and Red-Edge Spectral Information for Leaf Area Index Retrieval. IEEE Journal of Selected Topics in Applied Earth Observations and Remote Sensing, 11(5), 1482–1493. DOI: 10.1109/jstars.2018.2813 281
Zheng, H., Cheng, T., Li, D., Zhou, X., Yao, X., Tian, Y., Zhu, Y. (2018). Evaluation of RGB, Color-Infrared and Multispectral Images Acquired from Unmanned Aerial Systems for the Estimation of Nitrogen Accumulation in Rice. Remote Sensing, 10(6), 824. DOI: 10.3390/ rs10060824
Adamu Sadiat I., Afolabi Sadioluwa O., Awosusi Monisola B., Ayeni David O., Mephors Mayowa J., Ogoliegbune Maureen O., Pelemo Oluwole John

