Jdaidi Nouri, Selmi Houcine, Aloui Foued, Chaabane Abbes
ABSTRACT. This paper aimed to investigate and analyse the diametric and spatial distribution of Prunus avium populations in Tunisia. This study may help us document better information about the ecological processes and its functioning. Dendrometric and ecological data were collected on four square plots of an area of 1 ha each within two forests, Tabarka and Ain Draham, in northwest Tunisia. The results presented in this work show that P. avium individuals present a diametrical structure in the form of an “inverted J” translated by the dominance of the seedlings compared to the other classes. The analysis of the spatial distribution shows that wild cherry is identified by its aggregates and variable size (approximately 5 m and 20 m). It is coherent with the mode of vegetative propagation by suckering and the dispersal of fruits by birds.
This investigation opens insight into other species to ensure good sustainable management of natural resources.
Keywords: Tunisia; Prunus avium; spatial structure; diametric structure.
Cite
ALSE and ACS Style
Nouri, J.; Houcine, S.; Foued, A.; Abbes, C. Spatial and diametric evolution of a rare species, Prunus avium, in different biotopes in northwest Tunisia. Journal of Applied Life Sciences and Environment 2022, 55 (3), 363-376.
https://doi.org/10.46909/alse-552070
AMA Style
Nouri J, Houcine S, Foued A, Abbes C. Spatial and diametric evolution of a rare species, Prunus avium, in different biotopes in northwest Tunisia. Journal of Applied Life Sciences and Environment. 2022; 55 (3): 363-376.
https://doi.org/10.46909/alse-552070
Chicago/Turabian Style
Nouri, Jdaidi, Selmi Houcine, Aloui Foued, and Chaabane Abbes. 2022. “Spatial and diametric evolution of a rare species, Prunus avium, in different biotopes in northwest Tunisia” Journal of Applied Life Sciences and Environment 55, no. 3: 363-376.
https://doi.org/10.46909/alse-552070
View full article (HTML)
Spatial and Diametric Evolution of a Rare Species, Prunus Avium, in Different Biotopes in Northwest Tunisia
Jdaidi NOURI*, Selmi HOUCINE, Aloui FOUED and Chaabane ABBES
University of Jendouba, Sylvo-Pastoral, Institue of Tabarka, Sylvo-Pastoral Ressources Laboratory, Tabarka, 8110, Tunisia; e-mail: houcine_selmi@live.fr; Foued.Aloui@gmail.com; chaabane.abbes@gmail.com
*Correspondence: jdaidi.nouri25@gmail.com
Received: Dec. 07, 2022. Revised: Mar. 08, 2023. Accepted: Mar. 08, 2023. Published online: Mar. 16, 2023
ABSTRACT. This paper aimed to investigate and analyse the diametric and spatial distribution of Prunus avium populations in Tunisia. This study may help us document better information about the ecological processes and its functioning. Dendrometric and ecological data were collected on four square plots of an area of 1 ha each within two forests, Tabarka and Ain Draham, in northwest Tunisia. The results presented in this work show that P. avium individuals present a diametrical structure in the form of an “inverted J” translated by the dominance of the seedlings compared to the other classes. The analysis of the spatial distribution shows that wild cherry is identified by its aggregates and variable size (approximately 5 m and 20 m). It is coherent with the mode of vegetative propagation by suckering and the dispersal of fruits by birds.
This investigation opens insight into other species to ensure good sustainable management of natural resources.
Keywords: Tunisia; Prunus avium; spatial structure; diametric structure.
INTRODUCTION
Biodiversity, which is the abundance of life in an ecosystem, including variation among genes, species, and functional features, has a significant impact on how well ecosystems work (Cardinale et al., 2012). In recent years, the advantages of biodiversity in forest ecosystems have received widespread attention, with evidence that it increases ecosystem production, resilience, and resistance to natural disturbances like drought and strong winds (Isbell et al., 2015). Fruit-bearing trees and shrubs are some of the species that contribute most to the ecological function of broad-leaved forests. They offer a variety of ecological services, including a source of food, pollination, genetic diversity for breeding programs, and even an important source of revenue for local residents (Powell et al., 2013). Forests’ capacity to adjust to a changing climate may be hampered by a loss of biodiversity. Hence, in a fast changing world, it is imperative to prevent the depletion of ecosystems, particularly forest ecosystems (Geburek and Konrad, 2008). The analysis of the spatial structure is an important factor that not only serves as a description of forest stands but also provides leads for the study of their dynamics (Paluch and Bartkowicz, 2004; Pitman et al., 2001). A precise and better understanding of forest spatial structures is one of the keys to the sustainable management of heterogeneous forests (Goreaud et al., 2002; Pommerening, 2006). Three types of spatial distributions are possible depending on the location of individuals in space.
For a random distribution, Ripley’s function is less than zero; it is greater than zero for an aggregate distribution and zero for a uniform distribution, as explained by various studies (Bütler, 2000; Mc Elhinny et al., 2005; Mitchell, 2005). The spatial distribution is the result of interactions of species with the abiotic environment (edaphic preference, adaptation to different light intensities) and the biotic environment (interspecific competition and dissemination by animals) (Jansen, 2003; Kumba, 2015; Pascal, 2003). Prunus avium is known as an economic species for local people in Tunisia. It is used in various fields such as forestry for its quality wood and in horticulture for its fruits and its capacity as a rootstock for Prunus varieties. Spatial characterization helps us analyse the disposition of P. avium in its area of distribution and to establish correlations with its main mode of dissemination. The structures of forest populations in Tunisia are also poorly known, but there are some studies, such as Hasnaoui et al. (2004); Jdaidi (2018) and Jdaidi et al. (2013), that have shown that this forest has lost a significant portion of its cover during the last period. The lack of ecological knowledge of these forest species has become an obstacle to the good management of forest stands. This study can provide a solution and fill this gap by focusing on the spatial and diametric characterization of P. avium in north-western Tunisia.
The aim of this study is to understand and analyse the evolution of the diameter and spatial distribution of P. avium in Tunisia and set guidelines and standards for more effective management of forests stands.
MATERIALS AND METHODS
Study site
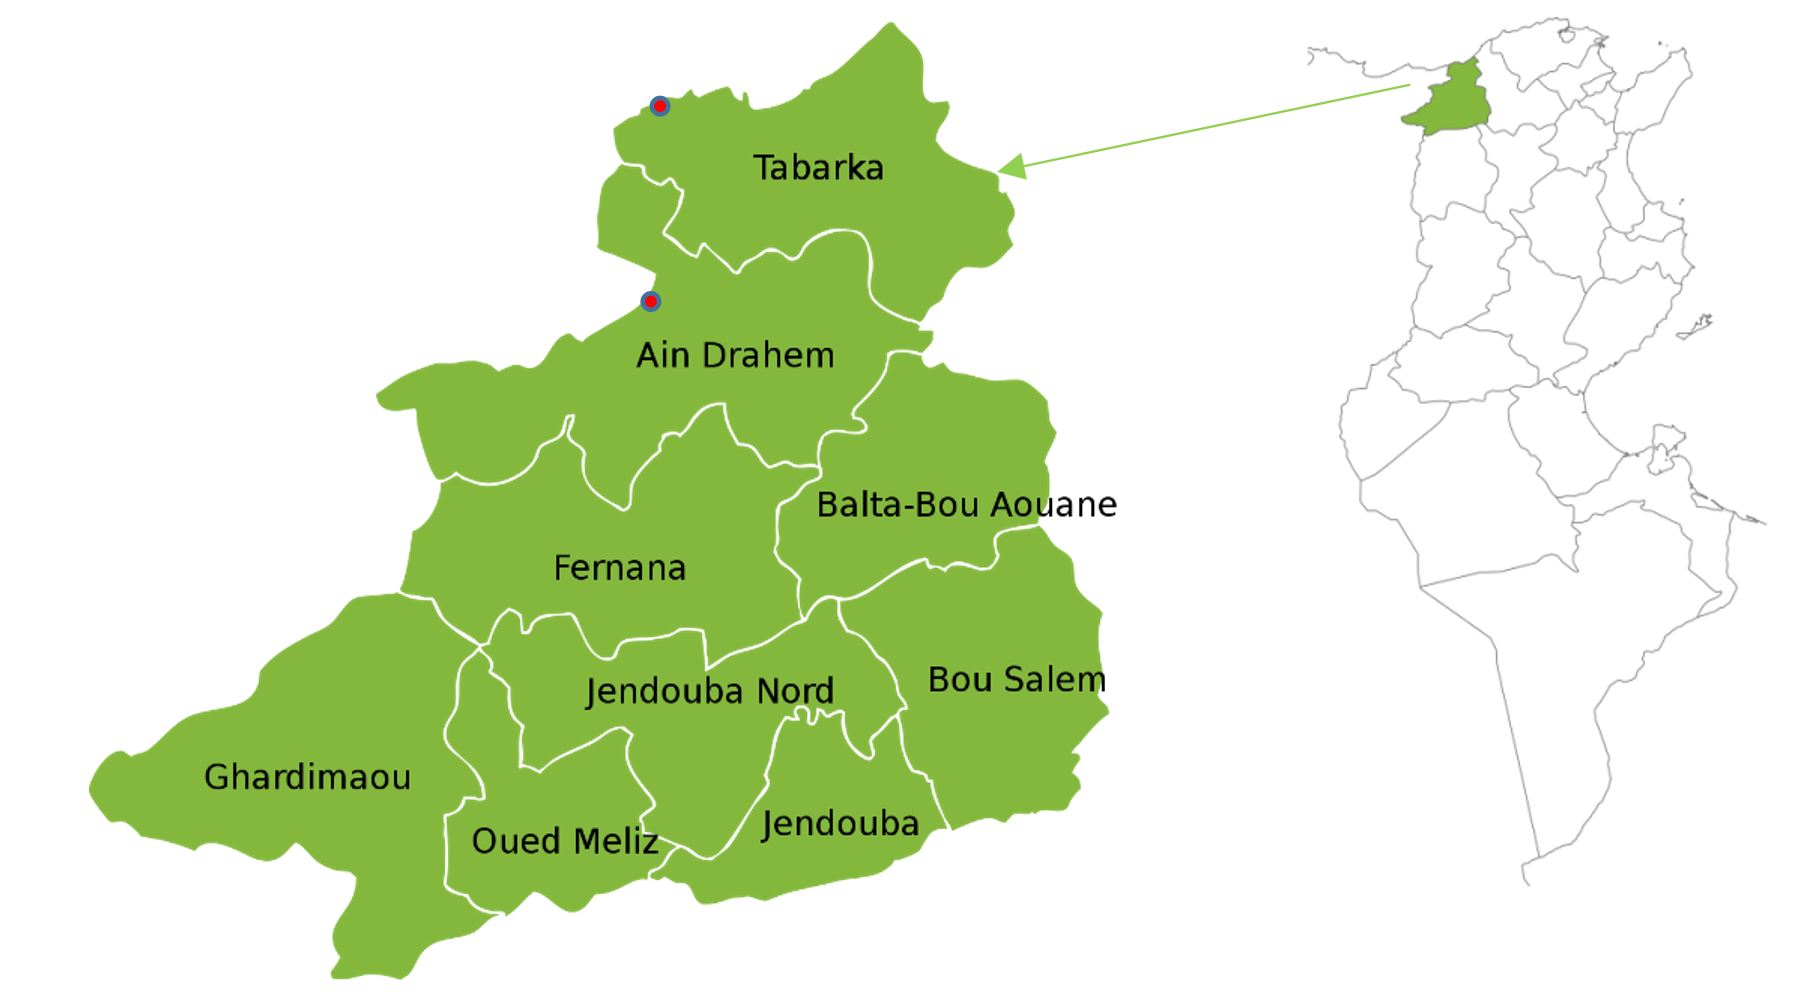
This study took place in two forests, the forest of Tabarka (N36°55’56” E008°56’47”) and the forest of Ain Draham (N36°46’13’’ E008°46’36’’) in north-western Tunisia. Based on the results of Jdaidi et al. (2014), we have chosen these two natural forests of P. avium (Table 1 and Figure 1). The study area is located at an altitude that varies from 320 m in Tabarka to 750 m in Ain Draham. The slope of the land is between 5% and 15% and is exposed to the northwest. The humid bioclimatic stage is represented by the well-watered region that makes up our study area. According to data from the two meteorological stations of Tabarka and Ain Draham, the average annual rainfall varies from 980 to 1512 mm. The average annual temperature varies little between the two sites (11–13 °C).
In addition to the type of soil, height, and exposure variables, these favorable climatic circumstances also have an impact on the distribution of naturally occurring flora that is rich in four taxa (P. avium, Quercus suber, Quercus canariensis, Quercus coccifera, Pinus pinaster and Olea europea).
Experimental equipment
The data was collected within the forests of Tabarka and Ain Draham. These stations were subdivided into four square plots of 1 hectare (100 m × 100 m). Each plot was subdivided into 100 elementary plots of 100 m² (10 m × 10 m).
Using the same method as previous authors (Abdourahmane et al., 2017; Akaffou, 2019; Kumba et al., 2013; Ngo Bieng, 2004; Ngo Bieng, 2007; Ngo Bieng et al., 2006), the ropes were used to connect the opposite poles to build a 10 m × 10 m grid over the entire plot. All P. avium individuals with collar diameters ≥ 5 cm were counted in each plot. The Cartesian coordinates (x, y) of the trees in each plot were measured from the origin of the axes. The position of each tree in the plots was determined using the classic method described by Picard and Gourlet (2008).
Table 1
Latitude, longitude, altitude and exposure geographical characteristics of the study sites (Jdaidi et al., 2022)
| Forestry canton | Tabarka | Ain Draham |
| Latitude (N) | N36°55’56” | N36°46’13’’ |
| Longitude (E) | E008°56’47” | E008°46’36’’ |
| Altitude (m) | 350 | 720 |
| Exposure | Northwest | Northwest |
| Bioclimate | Humid | Humid |
| Annual rainfall (mm) | 1100 | 1510 |
| Average annual temperature (ºC) | 12.6 | 10.1 |
The materials used in our study were a GPS for taking geographical coordinates, ropes for the delimitation of plots, two penta decameters for the delimitation of quadras and two-meter tapes for measuring the circumferences of trees.
Influence of edaphic factors on the spatial distribution of wild cherry in Tunisia
Two soil profiles per forest were opened in order to evaluate the impact of edaphic elements on the evolution of the P. avium forest. In total, four profiles were dug, and two samples were collected at two depths of 20–40 cm and 40–60 cm for each site, i.e., eight soil samples. For each site, the coordinates and altitude indicated by the GPS were recorded on a descriptive sheet, as well as the slope, orientation and type of observable plant formation. Upon arrival at the Sylvo-Pastoral Research Laboratory in Tabarka, the soil samples were treated as follows:
- dried in the open air on sheets of paper;
- ground to obtain a fraction of fine earth;
- shredded material was sieved using a 2 mm sieve.
The particle size analysis was carried out using a Robinson pipette. The particle size analysis is carried out on a test sample of fine earth (elements ≤ 2 mm). For the pH analysis, we sieved the samples at 2 mm, making it possible to separate the fine earth (i.e., the fraction less than 2 mm) from the skeleton (fraction greater than 2 mm), which were kept separate in two plastic bags bearing the date and the declaration number.
We used the glass electrode electrometric method. We determined the dosage of organic matter and total carbon by the method of WALKLY and BLACK (Balesdent et al., 1991; Duchaufour, 1977). The dosage of organic matter is carried out from the dosage of one of its constituents (total carbon). Assuming that organic matter contains on average 58% carbon, it is possible to calculate its rate in the soil from organic carbon. The value of MO (%) is given by multiplying the value of carbon (C %) by the coefficient (1.75): MO (%) = C (%) × 1.75. The determination of total nitrogen was carried out by the KJELDAHL method (Duchaufour, 1977). Most nitrogen in the soil is in organic form. The soil analysis focused on 12 parameters: total pH H2O, total fine silt (FSi), total coarse silt (CSi), total fine sand (FS), total coarse sand (CS), total clay (C), total organic (MO), total nitrogen (NT), total C/N ratio, total carbon (CT), saturation rate (SR) and assimilable phosphorus (P205).
Spatial structure analysis
Determination of the spatial distribution of our species was carried out using the multi-scale method of Ripley (1977). This method accounts well for local variations in the spatial structure. It allows a statistical validation of the results and circumvents the difficulties related to the sizes of the samples and the configuration of the scales of studies.
This method is widely used for studies on the spatial structure of trees in the forest, as explained by various studies (e.g., Akaffou, 2019; Batista and Maguire, 1998; Goreaud et al., 2002; Ngo Bieng, 2007; Ngo Bieng et al., 2006). It determines whether a given distribution is random, clustered or regular according to a comparison of the distribution of distances between trees and the distribution under the null hypothesis.
Ripley defines the function K(r) such that n * K(r) is the expectation of the number of neighbours at a distance r from any point in the seedling (Eq. 1).

Ripley’s method enables us to determine the position of all the trees in the study area. It makes it possible to characterize the spatial structure simultaneously for several distances (Batista and Maguire, 1998; Cressie, 1993; Ngo Bieng, 2007; Stoyan and Penttinen, 2000). We used Besag’s L(r) function (in Ripley, 1977), which is a transformation of Ripley’s K function, whose estimator is written in the following equation (Eq. 2):

Fonton et al. (2012) illustrated that if the position of the L(r) curve is inside the confidence intervals, it means that the distribution of points is significantly random. When the L(r) curve is located above the upper confidence interval, the distribution of points is clustered for the corresponding distances.
Alternatively, when the position of the L(r) curves below the confidence interval, it means that the distribution of the points is regular.
By using the method of Abdourhamane et al. (2017), we limited ourselves to a distance of 50 m for the estimation of the K(r) function because the number of pairs of points used in the calculation of K(r) decreases when r increases and the interpretation of the values of K(r) no longer makes sense for large values of r.
Thus, the polar coordinates transformed into Cartesian coordinates for all the adult P. avium individuals with a diameter ≥ 5 cm were subjected to a spatial structure.
Programita software developed by Wiegand (2014) was used to process and analyse spatial and diametric structure data.
Regarding the study of the relationship between the physico-chemical properties of the soil and the spatial distribution of P. avium within the study area, we performed a principal component analysis (PCA) on a “density × soil textural and chemical variable” using Pearson’s R correlation coefficients using XLSTAT 2021 software.
RESULTS
Study of the diametrical structure
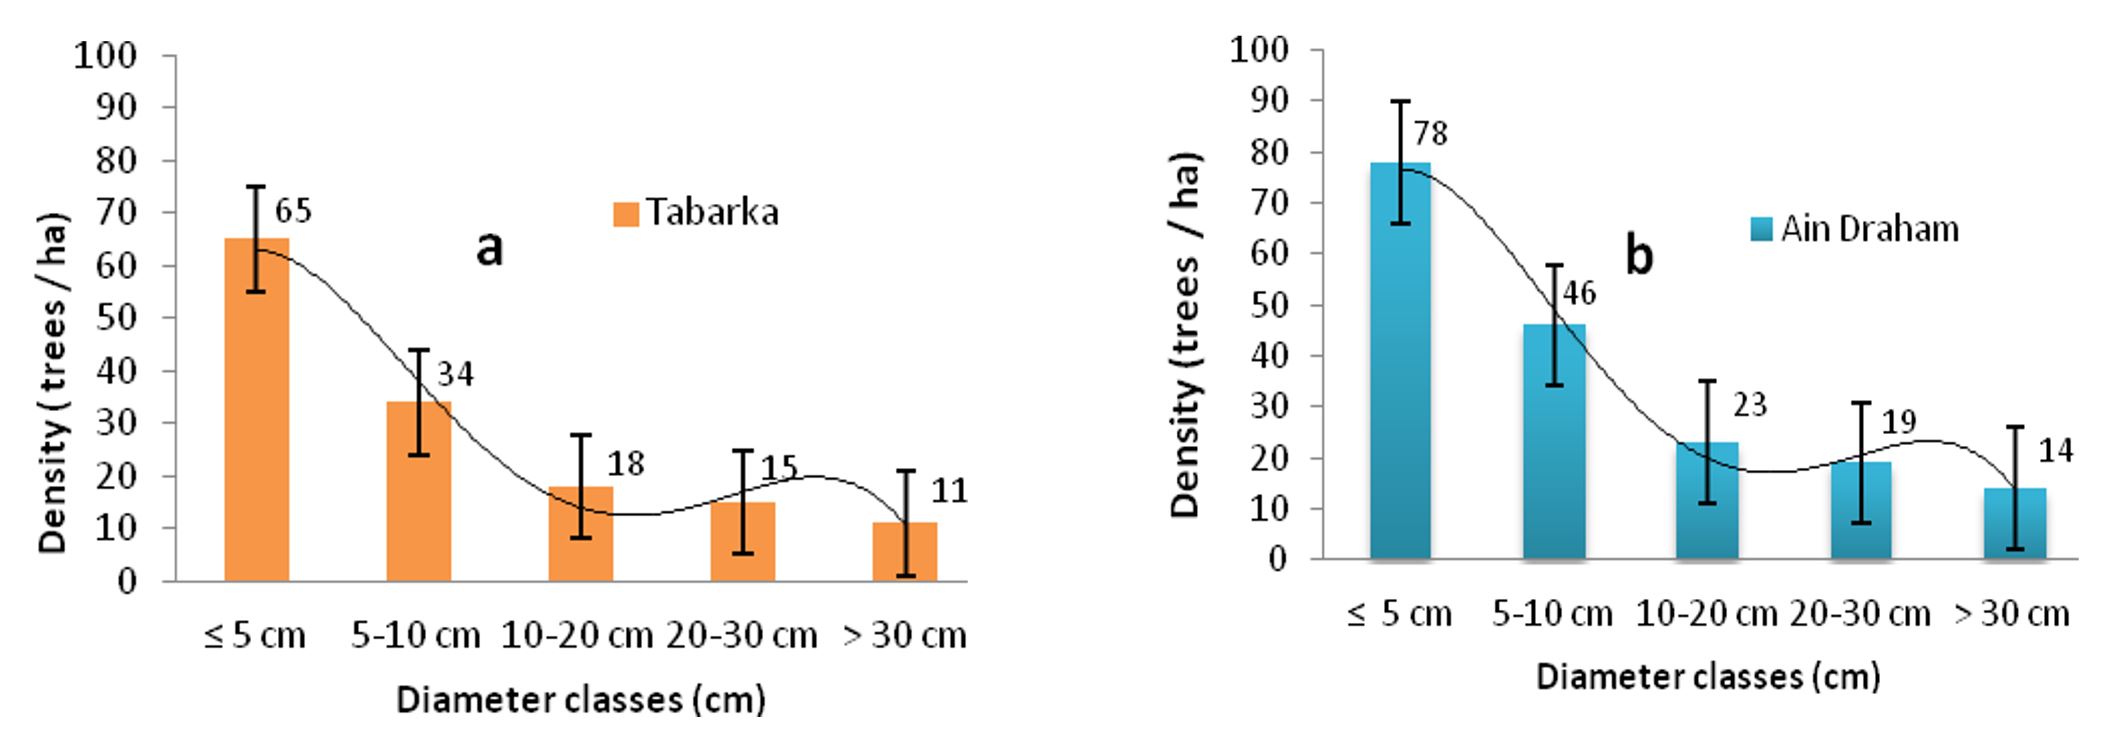
The results of the densities of individuals by diameter class and by forest are shown in Figure 2a and b. The average density of P. avium seedlings’ collar diameters was ≤ 5 cm, with 65 individuals/ha at the Tabarka stations and 79 individuals/ha at Ain Draham.
In addition, individuals in diameter classes of 5–10 cm represent a density of 22 plants/ha in Tabarka and 27 plants/ha in Ain Draham. However, the densities of trees with diameters of 10–20 cm were 18 plants/ha in Tabarka and 23 plants/ha in Ain Draham; however, low densities were recorded for seed classes > 30 cm in both forests, i.e., five individuals/ha (Tabarka) and eight individuals/ha (Ain Draham). The diameter distribution of the trees shows a decreasing distribution with a predominance of individuals with small diameters (≤ 5cm), reflecting the regular dynamics of populations of P. avium in all the stations, as illustrated in Figure 2a and b. As can be seen, the results obtained showed that the regressive evolution of the diameter classes gives the diameter structure an “inverted J” for the two populations at Tabarka and Ain Draham and with a good abundance of seedlings.
Spatial distribution study
The distribution maps of P. avium observed at the level of the two predominant forests highlight the areas where individuals are concentrated and the overall spatial structure of the studied plots.
The analysis of the L(r) curve of P. avium from the Tabarka forest reveals that there is an aggregative tendency between its individuals around 5–15 m, becomes random again from 18 to 22 m and finally, in aggregates between 35 and 45 m average radius in plot a.
In plot b of Tabarka, the feet of P. avium presents an aggregative distribution from 5 to 9 m, then a random distribution from 10 to 16 m, becomes aggregative again from 16 to 26 m and finally, the cherry trees are distributed randomly from 27 m, as illustrated in Figure 3a and b.
By looking at the shape of the L(r) curve of plot c of Ain Draham, it appears that there is an aggregative tendency up to 5 m, then a random tendency from 5 to 10 m in radius, then three scales of aggregations: one at a longer distance with an average radius of 10 m, the other two shorter ones are with average radii of 2 and 4 m. Instead, in plot set c, the statistical tests indicate a structure not significantly different from a random distribution.
In plot (d) the curve L(r) begins with two aggregative trends, the first of 9 m and the second of 5 m, then a random distribution between 20 and 26 m, it becomes random again between 20 and 26 m and finally, this species is distributed in an aggregative manner at a distance of 8 m and 2 m, as explained in Figure 4c and d.
Influence of chemical composition on the spatial distribution of P. avium
To better understand the relationship between the spatial distribution of wild cherry and the different soil properties, a principal component analysis (PCA) was carried out using 12 variables: pH, N, CT, C/N, P2O5, CS, FS , OM, CSi, FSi, SR and C.
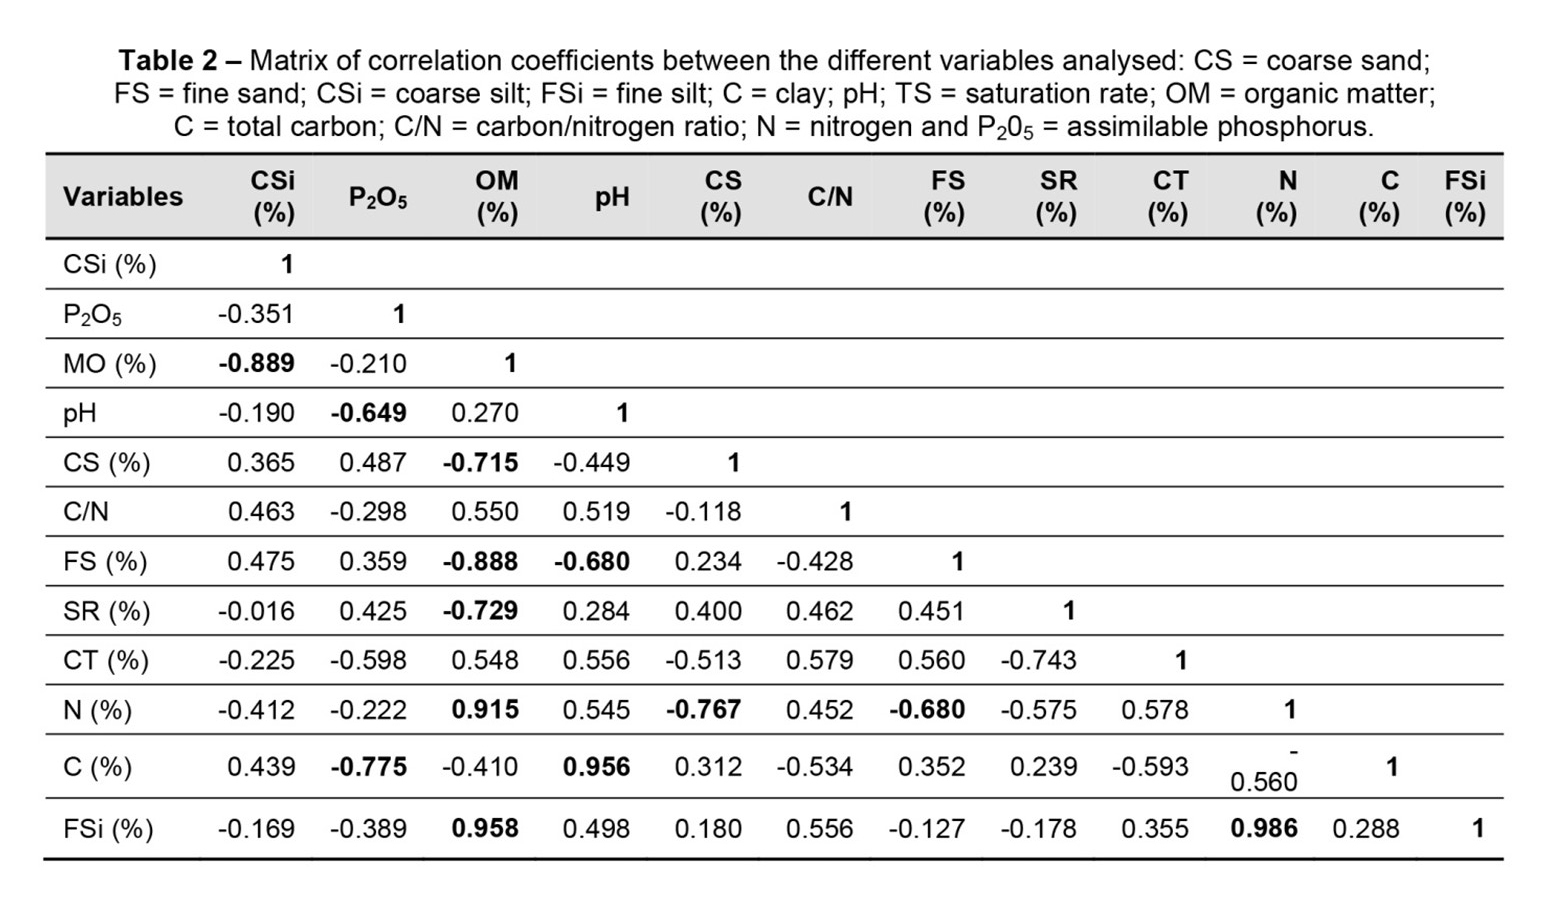
We chose to perform a PCA on two axes; according to the eigenvalues (Figure 5 and Table 2), the percentage of total variance explained by each axis is quite high, even if it is never very high (the maximum is 36.31%). The percentage of total variance explained by the two axes is 56.66%.
According to Figure 5, axis 1 absorbs 20.35% of the total variation; it is positively defined by the soil pH, the C/N ratio and the clay content (C). The other parameters (carbon total and coarse silt) contribute slightly. This axis is defined negatively with the assimilable phosphorus content (P2O5). Axis 2 absorbs 36.31% of the total inertia, and it is positively defined by the nitrogen content (N), the fine silt content (FSi) and the organic matter content (OM). On the same axis, there is a negative correlation between the density of P. avium and the rate of sand (CS and FS) and the rate of saturation (SR).
DISCUSSION
Diameter class distributions are the most appropriate models that provide several categories of information about forests. They reflect the dynamic state of the cherry ecosystem in Tunisia. The distribution of P. avium in diameter classes follows the “inverted J” pattern for the two populations in our study, with a good abundance in the seedling classes. However, the drop-in density from class 5–10 m is explained by the local population using seedlings as rootstock for cherry trees.
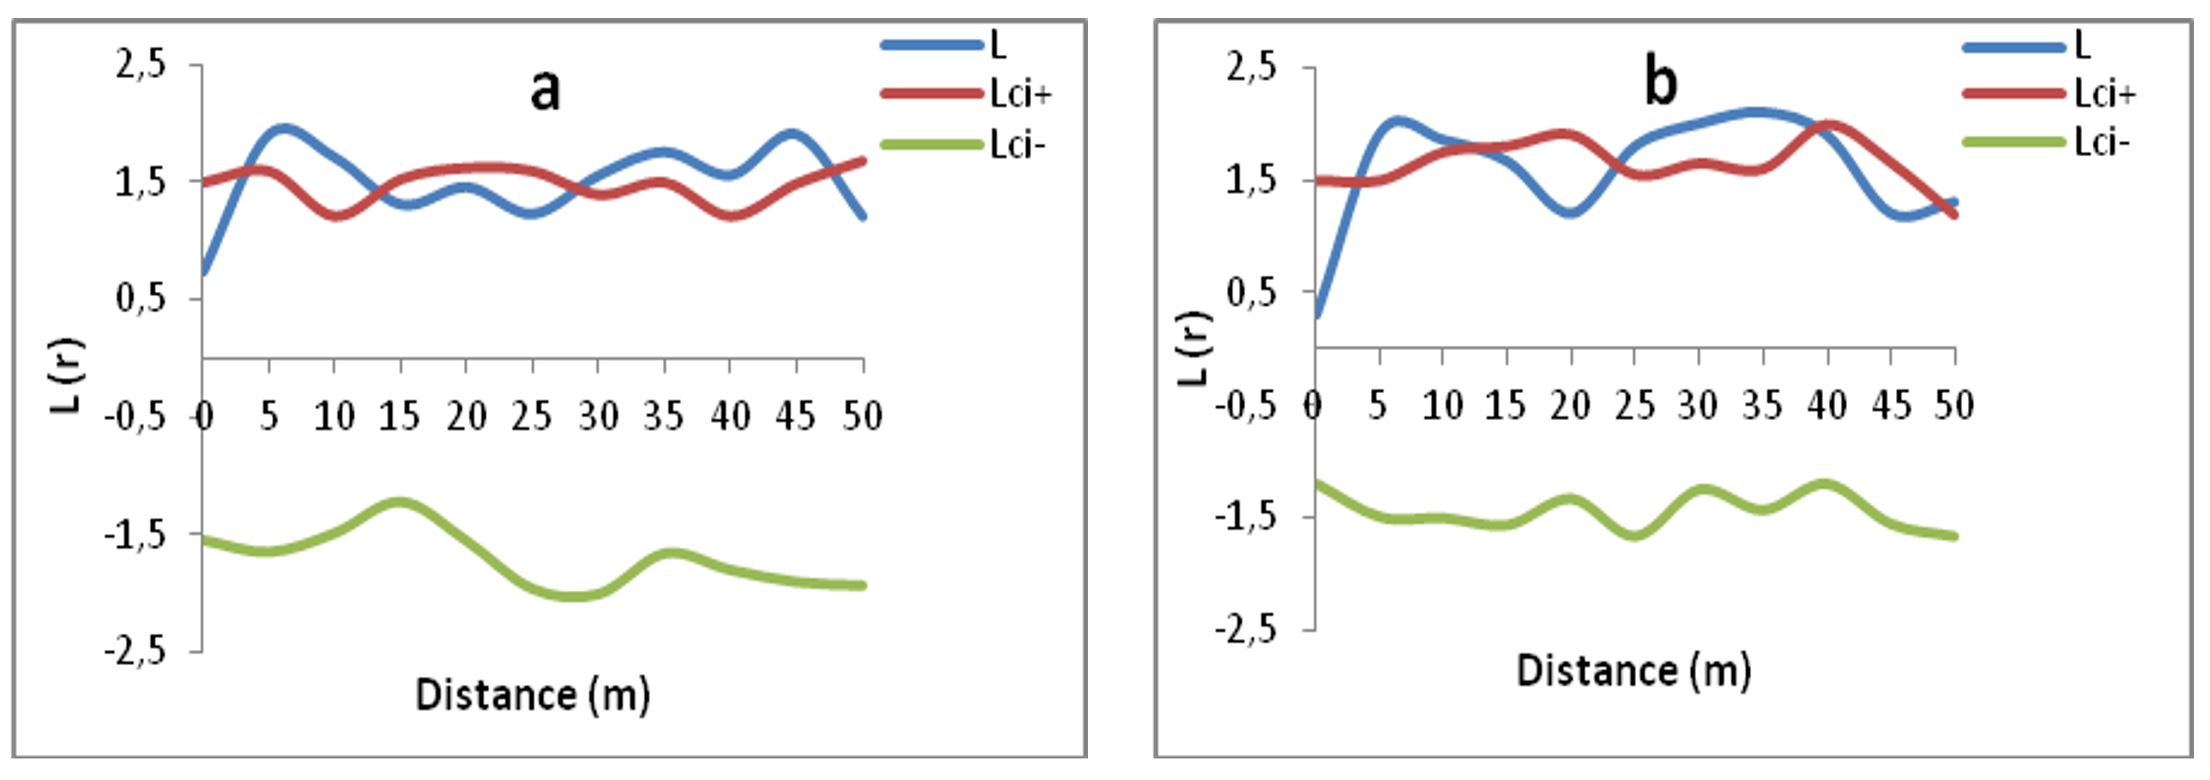
Figure 3 – Analysis of the spatial distribution of adult cherry trees (≥ 5 cm) within plots (a and b) of the Tabarka population (L: Riply curve and Lic- and Lic +: lower and upper confidence limits, respectively)
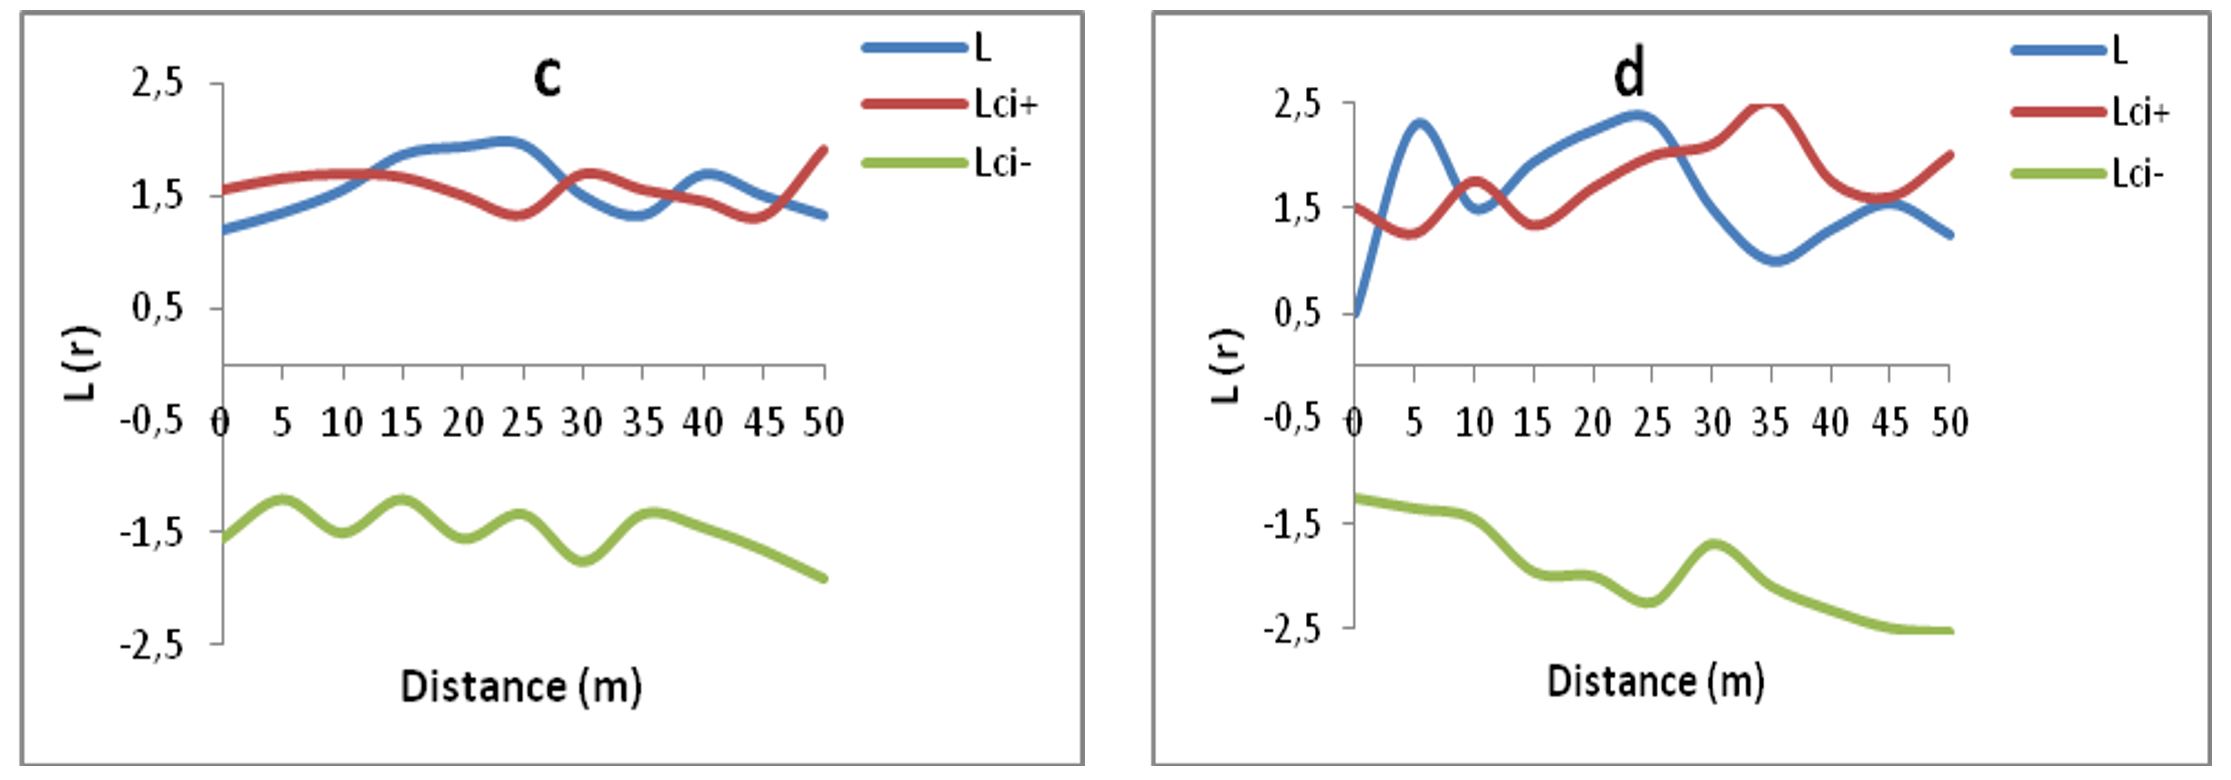
Figure 4 – Analysis of the spatial distributions of adult cherry trees (≥ 5 cm) within plots (c and d) of the Ain Draham population (L: Riply curve and Lic- and Lic +: lower and upper confidence limits, respectively)
The progressive decrease in the number of trees in classes, which is greater than or equal to 20 cm, is the result of cuts observed especially in our fieldwork. Owing to its wood quality, the local populations are very interested in this tree and using its wood in a variety of products, especially for cabinet wood. These results show a strong anthropic pressure exerted on the two wild cherry populations in northwest Tunisia.
Prunus populations in Tunisia show a random and aggregative spatial distribution. The random spatial structure results from the intervention of the local population using its wood for cabinetmaking and the seedlings as rootstock for cherry trees. The aggregative distribution is also explained by the dissemination of wild cherry seeds by birds and especially by the natural regeneration of this species by suckering. Bellefontaine (2005), Jdaidi et al. (2014) and Jdaidi et al. (2017) indicated that P. avium showed the best suckering ability for the different study areas with an average frequency of 80% and the distance of suckers from the mother plant reaching 15–20 m for some stations. Abdourahamane et al. (2017) and Bationo et al. (2005) revealed that the aggregative distribution is favoured for suckering and there is a marked preference of certain species for given soil conditions.
In our study, P. avium grew in environments with favourable conditions, such as on loamy-sandy soils, low slopes and northwest exposures. Similar results were obtained by Silvertown (2004) on other species like S. scheffleri, X. monospora, M. holstii, T. johnstoni, D. afromontana and C. gorungosanum they revealed that the aggregate spatial distributions of these species can be interpreted by the change of the environmental conditions. Likewise, Shackleton et al. (2003) showed that the spatial distribution of a species results from the interaction of biotic and abiotic factors. According to Kumba et al. (2013), the horizontal distribution of species results from the combination of two main factors: the soil requirements that lead to local variations in specific density and the type of intrinsic spatial structure of the species.
The fruits of P. avium are very popular with consumers such as birds or people who can ensure its dispersal. This zoochoric dispersal is relatively short from the trunk of the seed tree. Various studies have shown that the mode of seed dispersal can also explain the aggregation of these species (Barbier et al., 2006; Condit et al., 2000; Djossa et al., 2008; Kakpo et al., 2018; Seidler and Plotkin, 2006). According to Traissac (2003), a greater aggregation is often observed for species disseminated at short distances of 20–50 m from the trunk of the seed tree, regardless of the mode of dispersal (zoochory, anemochory, etc.). Ngo Being (2007) showed that white beam presents an aggregation of 18 m; birch is characterized by an aggregative structure of 10–36 m. The hornbeam has a specific aggregate structure that ranges from 5 to 25 m at the temperate forest level.
The densest stations are the richest in silt, nitrogen, organic matter and with a low C/N ratio (less than 10). These results suggest that, in addition to light, certain soil parameters (such as texture, nitrogen content, organic matter and C/N ratio) may also condition the natural distribution of P. avium. This species seems to favour silty, nitrogenous soil.
Numerous studies highlight the relationship between nitrogen, pH, organic matter, the C/N ratio and the natural distributions of certain tree species in Mediterranean forests (Jones et al., 2006; Russo et al., 2005; Potts et al., 2002). In their studies on the ecological habitats of P. avium in Spain, France and Tunisia, Gonzalez (2004), Jdaidi and Hasnaoui (2018) and Laurrieu et al. (2012) concluded that this species was associated with a pH gradient between 4.6 and 7.5. This species was found on soils rich in nitrogen (0.11–0.84%) and therefore with a C/N ratio between 3.64 and 13.52. This species is very common on soils with silty or silty-clay textures. It is very sensitive to compaction and strong compactness of the soil; it prefers well-structured soils.
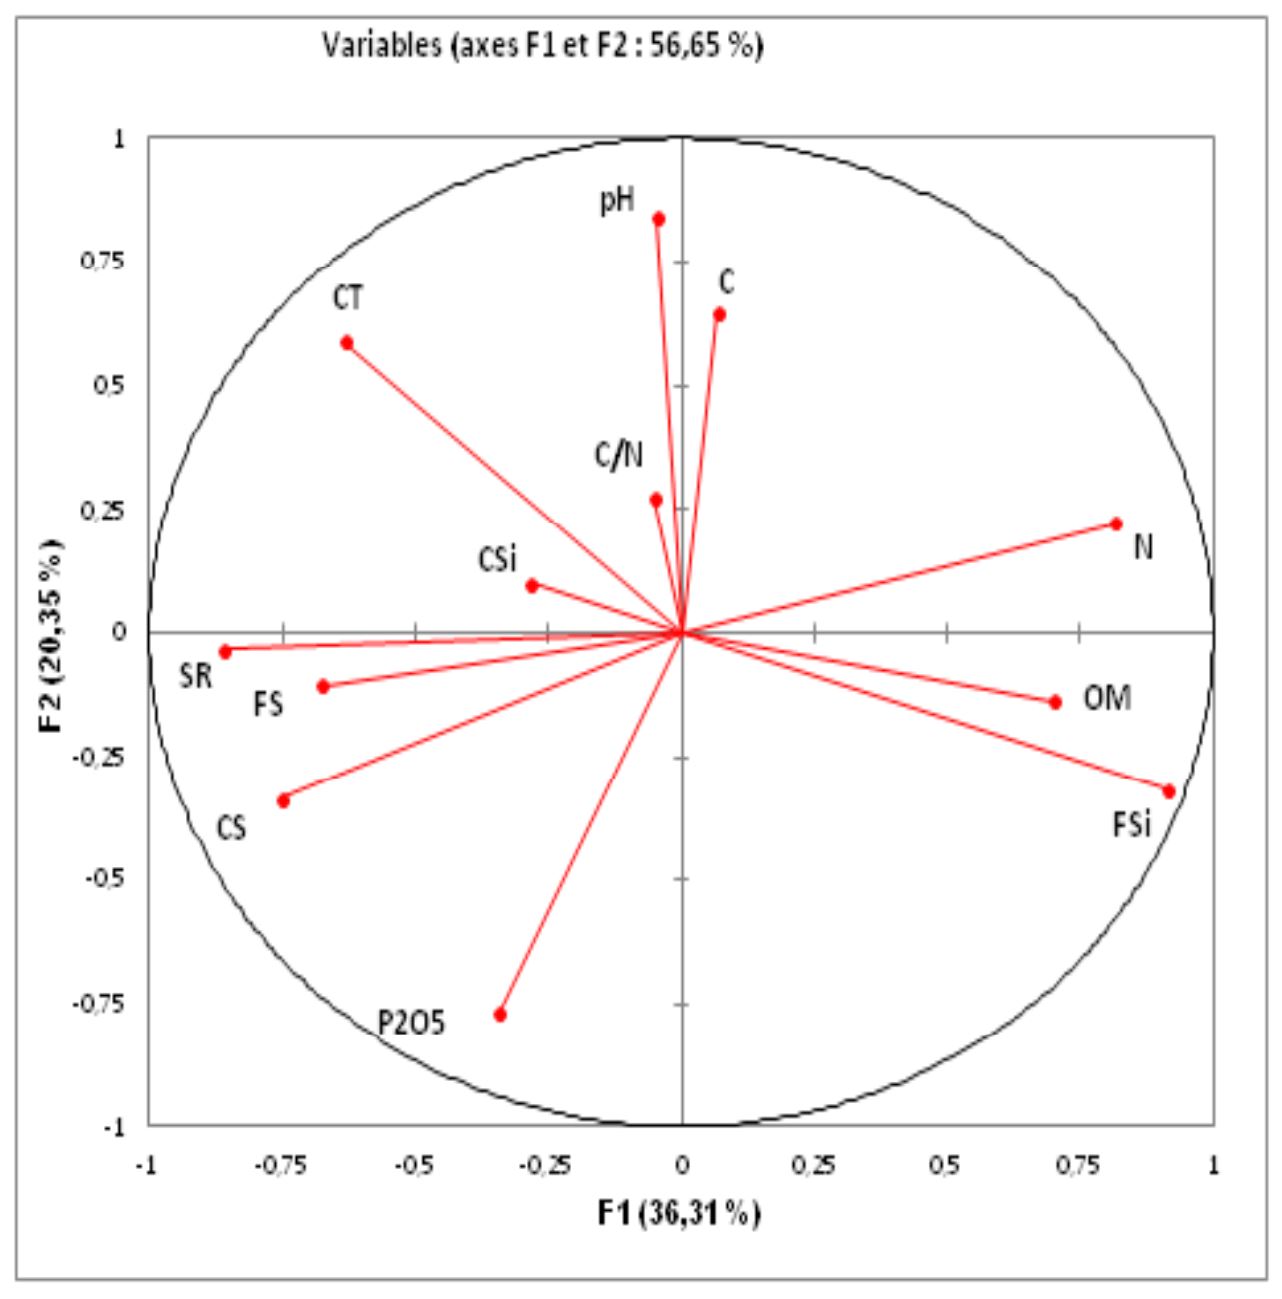
Figure 5 – Principal component analysis: distribution of parameters on the plane defined by axes 1 and 2. CS = coarse sand; FS = fine sand; CSi = coarse silt; FSi = fine silt; C = clay; pH; SR = saturation rate; OM = organic matter; CT = total carbon; C/N = carbon/nitrogen ratio; N = nitrogen and P205 = assimilable phosphorus
CONCLUSIONS
The main objective of this work was to characterize the diameter and spatial distribution of wild cherry in Tunisia to understand the strategy developed by this species in the process of occupying space. The distribution of stems in the diameter classes confirmed the disturbance of the two studied forests, with an abundance of seedlings (≤ 5 cm) and a decrease in the densities of the other classes. This study showed that P. avium in both biotopes is distributed in aggregates. The aggregation observed is partly linked to the mode of dissemination of cherries and the mode of regeneration by suckering. This spatial structure is the result of favourable environmental factors for the ecological habitat of this species. This study allows us to give an idea on the evolution of the spatial distribution of this species. This study is used for the sustainable forest management of this species, maintaining its productivity, regeneration capacity, and vitality, relevant ecological, economic, and social roles for the local community today and in the future.
Author Contributions: Conceptualization (J.N., S.N., C.A.); methodology (J.N., S.N.); analysis (J.N.); investigation (A.F.); data curation (J.N., A.F.); writing, review (J.N.); supervision (J.N., C.A.).
All authors declare that they have read and approved the publication of the manuscript in this present form.
Acknowledgments: All thanks go to the team of the Sylvo-Pastorales Resource Laboratory of Tabarka, who made available all the necessary means to complete this work.
Declaration of competing interest: Authors declare no conflict of interest.
REFERENCES
Abdourhamane, H.; Rabiou, H.; Diouf, A.; Morou, B.; Mahamane, A.; Bellefontaine, R. Demographic structure and spatial distribution of the populations of Sclerocarya birrea in the Sahelian sector of Niger. Bois et Forêts Des Tropiques. 2017, 55-66.
Akaffou, E.T. Spatial distribution of four predominant tree species in three fragments of the Haut-Sassandra classified forest (Central-West, Ivory Coast). MSc Thesis of Agriculture and Forestery. 2019, 56.
Balesdent, J.; Petraud, J.P; Feller, C. Effects of ultrasound on the particle size distribution of soil organic matter. Science du Sol. 1991, 29, 95-106.
Barbier, N.; Couteron, P.; Lejoly, J.; Deblauwe, V.; Lejeune, O. Self-organized patterning as fingerprint of climate and human impact on semi-arid ecosystems. Journal of Ecology. 2006, 94, 537-547. https://doi.org/10.1111/j.1365-2745.2006.01126.x.
Bationo, B.A.; Ouedraogo, S.J.; Somé, A.N.; Pallo, F.; Boussim, I.J. Natural regeneration of Isoberlinia doka Craib. and Stapf. in the Nazinon classified forest (Burkina Faso). Cahiers Agricultures. 2005, 14, 297-304.
Batista, J.L.F.; Maguire, D.A. Modeling the spatial structure of tropical forests. Forest Ecology and Management. 1998, 110, 293-314. https://doi.org/10.1016/S0378-1127(98)00296-5.
Bellefontaine, R. For many ligneous species, sexual reproduction is not the only way: analysis of 875 cases – Introductory text, table and bibliography. Sécheresse. Revue électronique 3E. 2005, 42-60.
Bütler, R. Analysis of the spatial distribution of objects in a landscape. Teaching sheet, Ecosystems Management Laboratory (GECOS), Lausanne. 2000, 11-18.
Cardinale, B.J.; Duffy, J.E.; Gonzalez, A., et al. Biodiversity loss and its impact on humanity. Nature. 2012, 486, 43-59. https://doi.org/10.1038/nature11148.
Cressie, N.A.C. Statistics for spatial data. Wiley Series in Probability and Mathematical Statistics. 1993, 635–900.
Condit, R.; Hubbel, S.P.; Baker, P.; Bunyavejchewin, S.; Gunatilleke, N.; Foster, R.D.; Itoh, A.; Lafrankie, J.V.; Lee, H.S.; Losos, E.; Manokatan, N.; Sukumar, R.Q.; Yamakura, T. Spatial patterns in the distribution of tropical tree species. Science. 2000, 288, 1414-1418. https://doi.org/10.1126/science.288.5470.1414.
Djossa, B.A.; Fahr, J.; Kalko, E.K.V.; Sinsin, B.A. Land use impact on Vitellaria paradoxa C.F. Gaertn. stand structure and distribution patterns: a comparison of Biosphere Reserve of Pendjari in Atacora district in Benin. Agroforestry Systems. 2008, 72, 205-220.
Duchaufour, P. Pedology. Pedogenesis and classification. Paris.1977, 477.
Fonton, N.H.; Atindogbe, G.; Fandohan, B.; Lejeune, P.; Ligot, G. Spatial structure of trees in wooded savannahs and Sudanian open forests: implications for forest enrichment (in French). Biotechnologie, Agronomie, Société et Environnement. 2012, 16, 429-440.
Geburek, T.; Konrad, H. Why the conservation of forest genetic resources has not worked. Conservation Biology. 2008, 22, 267-274. https://doi.org/10.1111/j.1523-1739.2008.00900.x.
Gonzalez, S.O. Autoecology of the mountain cherry (Prunus avium) in Castilla y León (in Spanish). PhD Thesis, Higher Technical School of Engineers of Monte, 2004.
Goreaud, F.; Loreau, M.; and Millier, C. Spatial structure and the survival of an inferior competitor: a theoretical model of neighborhood competition in plants. Ecological Modelling. 2002, 158, 1-19. https://doi.org/10.1016/S0304-3800(02)00058-3.
Hasnaoui, B.; Abbes, C.; Elghzel, A.; Yaccoubi, W. Structure and architecture of the oak forests of northwest Tunisia, present and future. Annales de l’I.N.G.R.E.F. 2004, 10-15.
Isbell, F.; Craven, D.; Connolly, J. Biodiversity increases the resistance of ecosystem productivity to climate extremes. Nature. 2015, 526:574–577. https://doi.org/10.1038/nature15374.
Jansen, P.A. Scatterhoarding and tree regeneration. Ecology of nut dispersal in a Neotropical rainforest. PhD Thesis, Wageningen University, 2003.
Jdaidi, N. Structure of the populations of the Tunisian cork oak forest: current situation and future of an ecosystem. Book, Noor Publishing. 2018, 61.
Jdaidi, N.; Hasnaoui, B. Effect of the station and the year of observation on the suckering capacity of Prunus avium in Kroumirie (North West of Tunisia). Journal of Advanced Research in Science and Technology. 2017, 4, 457-466.
Jdaidi N.; Hasnaoui B. Study of the ecological habitat of a rare species (Prunus avium L.) in the northwest of Tunisia. Acta Botanica Malacitana. 2018, 43, 1-8. http://dx.doi.org/10.24310/abm.v43io.4152
Jdaidi, N.; Hasnaoui, F.; Boussaidi, N.; Abbès, C.; Hasnaoui, B. Effects of environmental factors on the diameter distribution of the cork oak in Kroumirie (Northwest Tunisia). Annales de l’INRGREF. 2013, 18, 1-14.
Jdaidi, N.; Selmi, H.; Aloui, F.; Abbes, C. Dynamics of the natural regeneration of a natural zeen oak (Quercus canariensis Willd.) forests in Kroumirie, north-western Tunisia. Arabian Journal of Geosciences. 2022, 15, 1661. https://doi.org/10.1007/s12517-022-10783-2.
Jdaidi, N.; Zouwawi, I.; Hasnaoui, F.; Boussaidi N.; Hasnaoui, B. Influence of climatic variables on the thickness of growth-rings in Tunisian cherry (Prunus avium) (in French). Revue d Ecologie. 2014, 69, 328-337.
Jones, M.M.; Tuomisto, H.; Clark, D.B.; Olivas P. Effects of mesoscale environmental heterogeneity and dispersal limitation on floristic variation in rain forest ferns. Journal of Ecology. 2006, 94, 181-195. https://doi.org/10.1111/j.1365-2745.2005.01071.x.
Kakpo, S.B.; Yehouénou, T.D.R.; Gbètoho, A.J.; Aoudji, A.K.N.; Ganglo, J.C. Spatial distribution of Cola millenii K. Schum., Dialium guineense Wild. and Afzelia africana Smith ex Pers. in the secondary forests of southern Benin (West Africa). International Journal of Biological and Chemical Science. 2018, 12, 353-362. https://dx.doi.org/10.4314/ijbcs.v12i1.28
Kumba, L.S. Spatial ecology of tree species in the Yoko forest reserve: spatial structure and identification of responsible ecological factors. PhD Thesis, Faculty of Sciences, University of Brussels, (Ubundu, Eastern Province, D.R. CONGO), 2015, 169.
Kumba, S.; Nshimba, H.; Ndjele, L.; De Cannière, C.; Visser, M.; Bogaert J. Spatial structure of the three most abundant species in the Yoko Forest Reserve, Ubundu, Democratic Republic of Congo (in French). Tropicultura. 2013, 31, 53-61. https://orbi.uliege.be/bitstream/2268/160258/1/2013.kumba.trop.pdf.
Laurrieu, L.; Gonin, P.; Coello, J. Autecology of Cherry (Prunus avium L.). Forêt-entreprise. 2012, 203, 9-12. https://hal.inrae.fr/hal-02647194/document.
Mc Elhinny, C.; Gibbons, P.; Brack, C.; Bauhus, J. Forest and woodland stand structural complexity: its definition and measurement. Forest Ecology Management. 2005, 218, 1-24. https://doi.org/10.1016/j.foreco.2005.08.034.
Mitchell, A. The ESRI Guide to GIS analysis: Volume 2, spatial measurements and statistics and zeroing. In: Geographic information systems at work in the community. 2005, 190.
Ngo Bieng, M.A. Analysis of the spatial structure of mixed sessile oak (Quercus petraea) and Scots pine (Pinus sylvestris) forest stands in the central region. DEA report. 2004, 51.
Ngo Bieng, M.A. Construction of spatial structure models to simulate realistic virtual stands. Application to mixed sessile oak-Scots pine stands in the central region. PhD Thesis. National School of Rural Water and Forest Engineering (ENGREF). 2007, 215. https://agritrop.cirad.fr/548022/1/document_548022.pdf
Ngo Bieng, M.A.; Ginisty, C.; Goreaud, F.; Perot, T. A first typology of Oak and Scots pine mixed stands in the Orleans forest (France), based on the canopy spatial structure. New Zealand Journal of Forestry Science. 2006, 36, 325-346. https://agritrop.cirad.fr/547920
Pascal, J.P. Notions on the structures and dynamics of tropical rainforests (in French). Revue Forestière Française. 2003, 55, 118-130. https://hal.science/hal-03449438/file/118_130.pdf.
Paluch, J.G; Bartkowicz, L.E. Spatial interactions between Scots pine (Pinus sylvestris L.), common oak (Quercus robur L.) and silver birch (Betula pendula Roth.) as investigated in stratified stands in mesotrophic site conditions. Forest Ecology and Management. 2004, 192, 229-240. https://doi.org/10.1016/j.foreco.2004.01.041
Picard, N., Gourlet-Fleury, S. Reference manual for the installation of permanent devices in production forests in the Congo Basin. CIRAD, Department of Environments and Societies, UPR Dynamics of Natural Forests, Montpellier, France. 2008, 265. http://hal.cirad.fr/docs/00/33/98/16/PDF/picard08d.pdf
Pitman Nigel, C.A.; John, W.T.; Miles, R.S.; Percy, N.V.; David, A.N.; Carlos, E.C.; Walter, A.P.; Milton, A. Dominance and distribution of tree species in upper Amazonian terra firme forests. Ecology. 2001, 82, 2101-2117. https://doi.org/10.1890/0012-9658(2001)082[2101:DADOTS]2.0.CO;2.
Pommerening, A. Evaluating structural indices by reversing forest structural analysis. Forest Ecology and Management. 2006, 224, 266-277. https://doi.org/10.1016/j.foreco.2005.12.039
Potts, M.D.; Ashton, P.S.; Kuafman, L.S.; Plotkin, J.B. Habitat patterns in tropical rain forests: A comparison of 105 plots in Northwest Borneo. Ecology. 2002, 83, 2782-2797. https://doi.org/10.2307/3072015.
Powell, B.; Ickowitz, A.; McMullin, S. The role of forests, trees and wild biodiversity for nutrition-sensitive food systems and landscapes. In: Expert background paper for the International Conference on Nutrition 2013, Food and Agriculture Organization of the United Nations, Rome, Italy.
Ripley, B.D. Modelling spatial patterns. Journal of the royal statistical society B. 1977, 39, 172-212. https://doi.org/10.1111/j.2517-6161.1977.tb01615.x.
Russo, S.E.; Davies, S.J.; King, D.A.; Tan, S. Soil-related performance variation and distributions of tree species in a Bornean rain forest. Journal of Ecology. 2005, 93, 879-889.
Shackleton, C.M.; Botha, J.; Emanuel, P.L. Productivity and abundance of Sclerocarya birrea subsp. caffra in and around rural settlements and protected areas of the Bushbuckridge lowveld, South Africa. Forests, Trees and Livelihoods. 2003, 13, 217-232. https://doi.org/10.1080/14728028.2003.9752459.
Seidler, T.G.; Plotkin, J.B. Seed dispersal and spatial pattern in tropical trees. PloS Biology. 2006, 4, 2132-2137. https://doi.org/1371/journalpbio.0040344.
Silvertown, J. Plant coexistence and the niche. Trends in Ecology and Evolution. 2004, 19, 605-611. https://doi.org/10.1016/j.tree.2004.09.003.
Stoyan, D.; Penttinen, A. Recent Applications of Point Process Methods in Forestry Statistics. Science. 2000, 15, 61-78. https://doi.org/10.1214/ss/1009212674.
Traissac, S. Spatial dynamics of Vouacapoua americana (Aublet), tropical rainforest tree with aggregated distribution. PhD Thesis, Laboratory of Biometrics and Evolutionary Biology UMR 5558 & CIRAD, University Claude Bernard – Lyon 1. 2003, 221.
Wiegand, T. User Manual for the Programita software. Version Januar. 15, 04318 Leipzig, Germany. 2014, 5-172.
Academic Editor: Dr. Mihaela Roșca
Publisher Note: Regarding jurisdictional assertions in published maps and institutional affiliations ALSE maintain neutrality.

